Back

2013 Weighted Results

Report Information

What is the Census?

The Census is a collaborative research project that started in 2002.

Although the BRC Census is technically a survey and not a real census (where everyone in a population was sampled), we aspire to be a true census where everyone voluntarily participates. Until that day, we will continue to provide the most complete picture possible of the highly diverse population of Black Rock City.
Photo

Method

Details about the weighting procedure

2013 Census Results

http://blackrockcitycensus.wordpress.com

Weighting the Census

Variables used to weight the 2013 Census

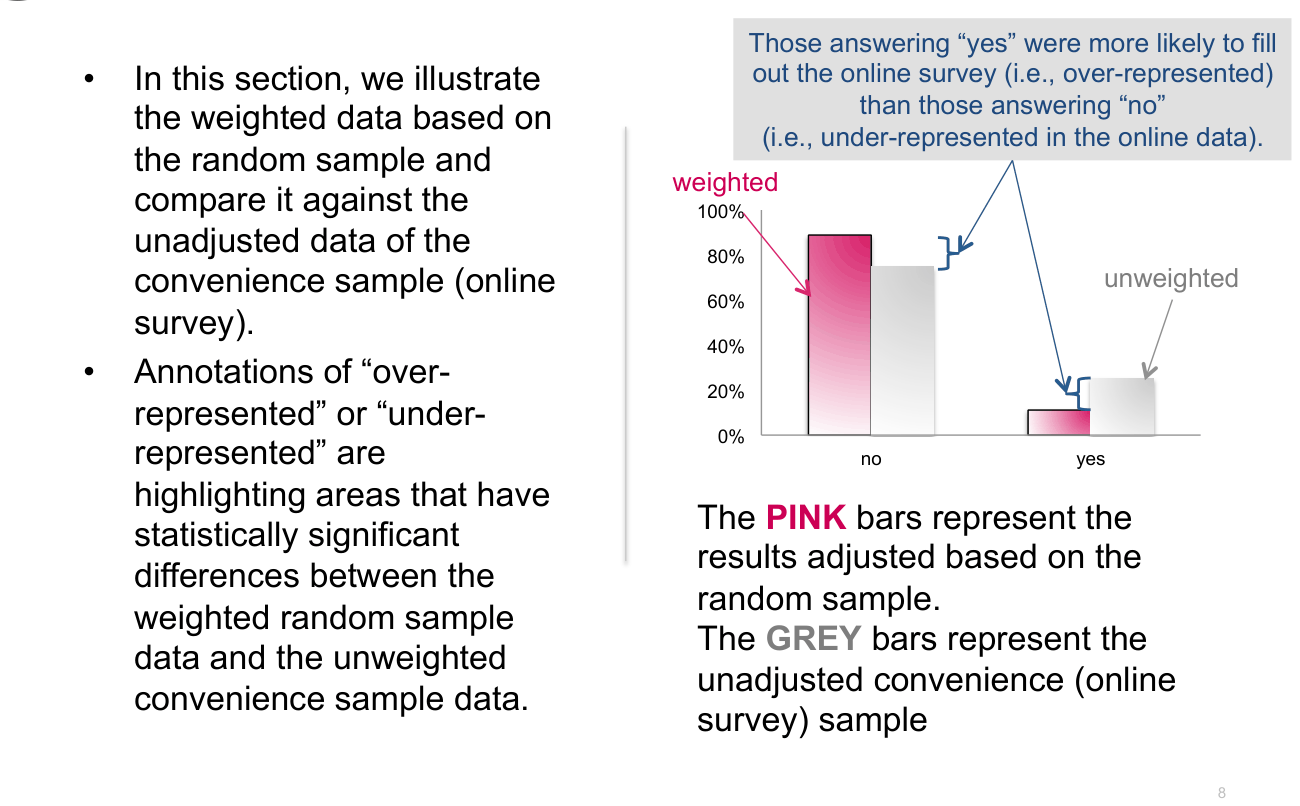
Understanding this section

Those answering “yes” were more likely to fill • In this section, we illustrate out the online survey (i.e., over-represented) than those answering “no” the weighted data based on (i.e., under-represented in the online data). the random sample and weighted compare it against the 100% unadjusted data of the 80% convenience sample (online unweighted 60% survey). 40% • Annotations of “over- 20% represented” or “under- 0% represented” are no yes highlighting areas that have The PINK bars represent the statistically significant results adjusted based on the differences between the random sample. weighted random sample The GREY bars represent the data and the unweighted unadjusted convenience (online convenience sample data. survey) sample

Weighting Variables

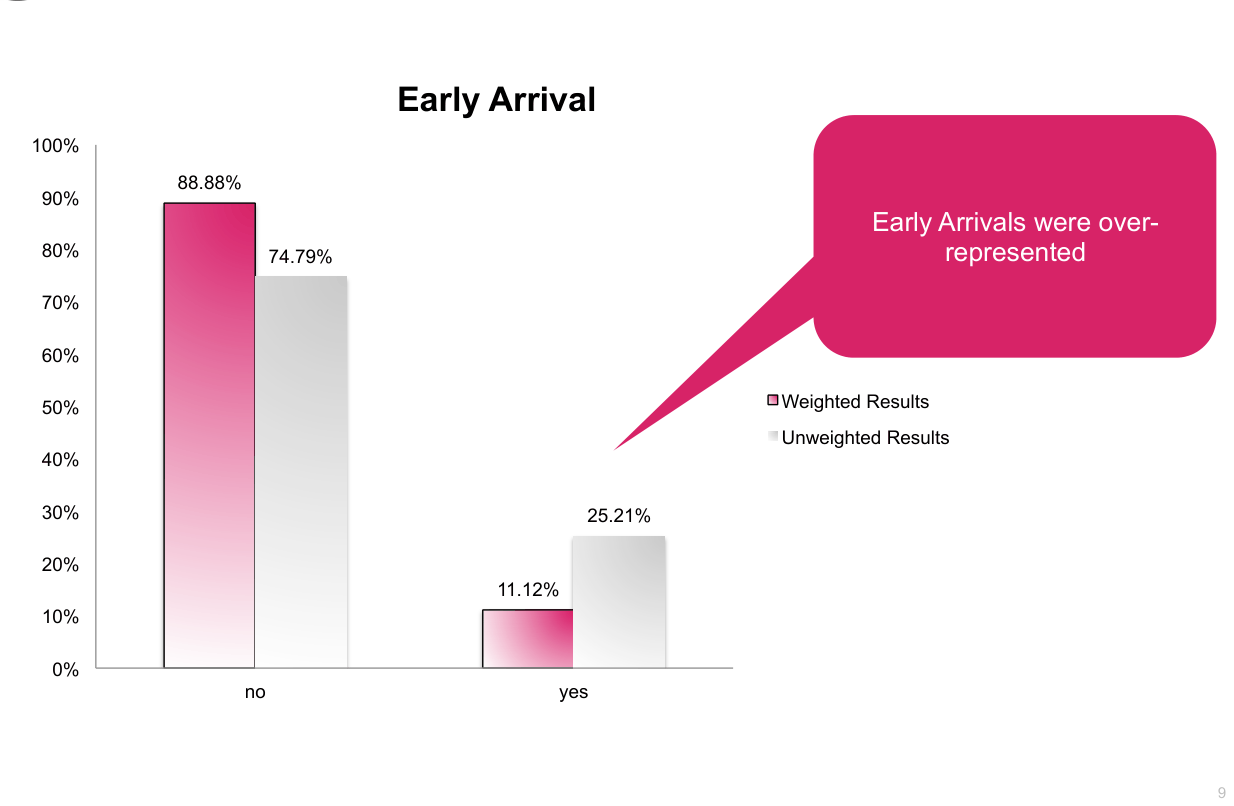
Early Arrival 100% 88.88% 90% Early Arrivals were over- represented 80% 74.79% 70% 60% Weighted Results 50% Unweighted Results 40% 30% 25.21% 20% 11.12% 10% 0% no yes
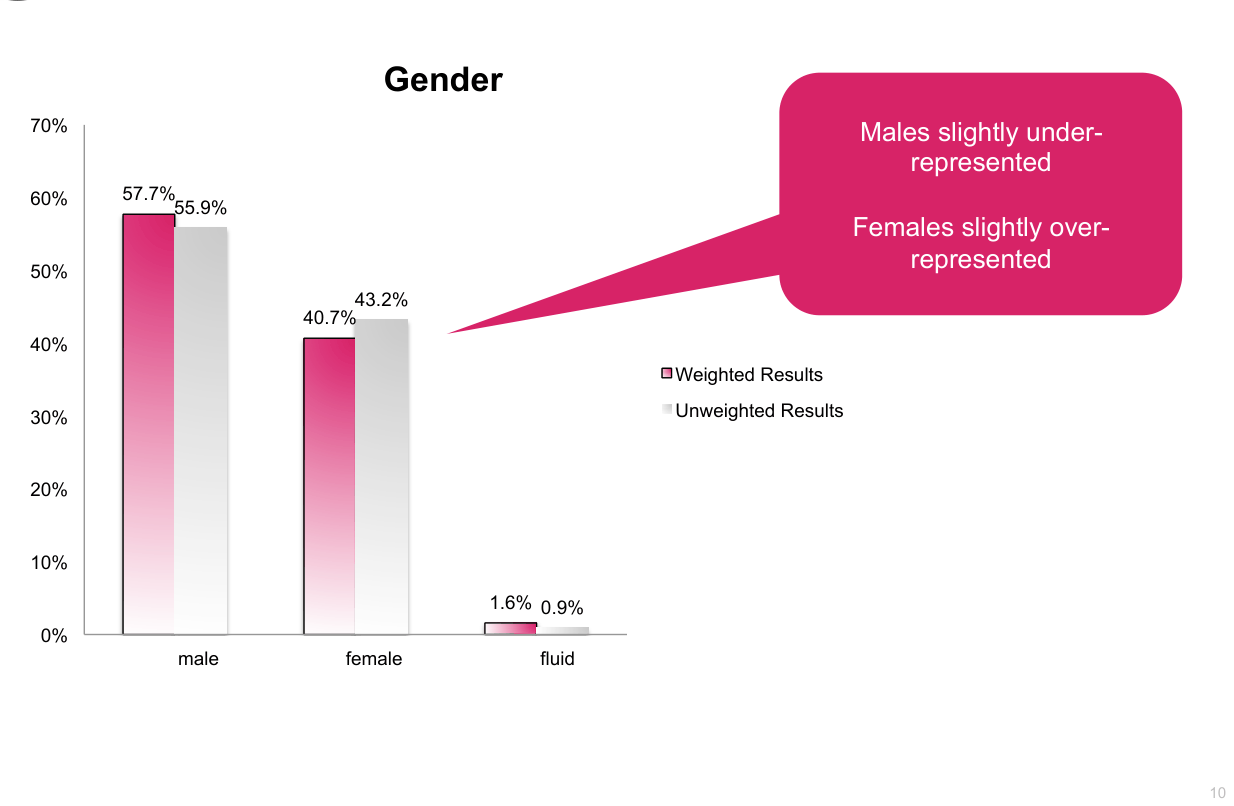
Gender 70% Males slightly under- represented 57.7% 60% 55.9% Females slightly over- represented 50% 43.2% 40.7% 40% Weighted Results Unweighted Results 30% 20% 10% 1.6% 0.9% 0% male female fluid
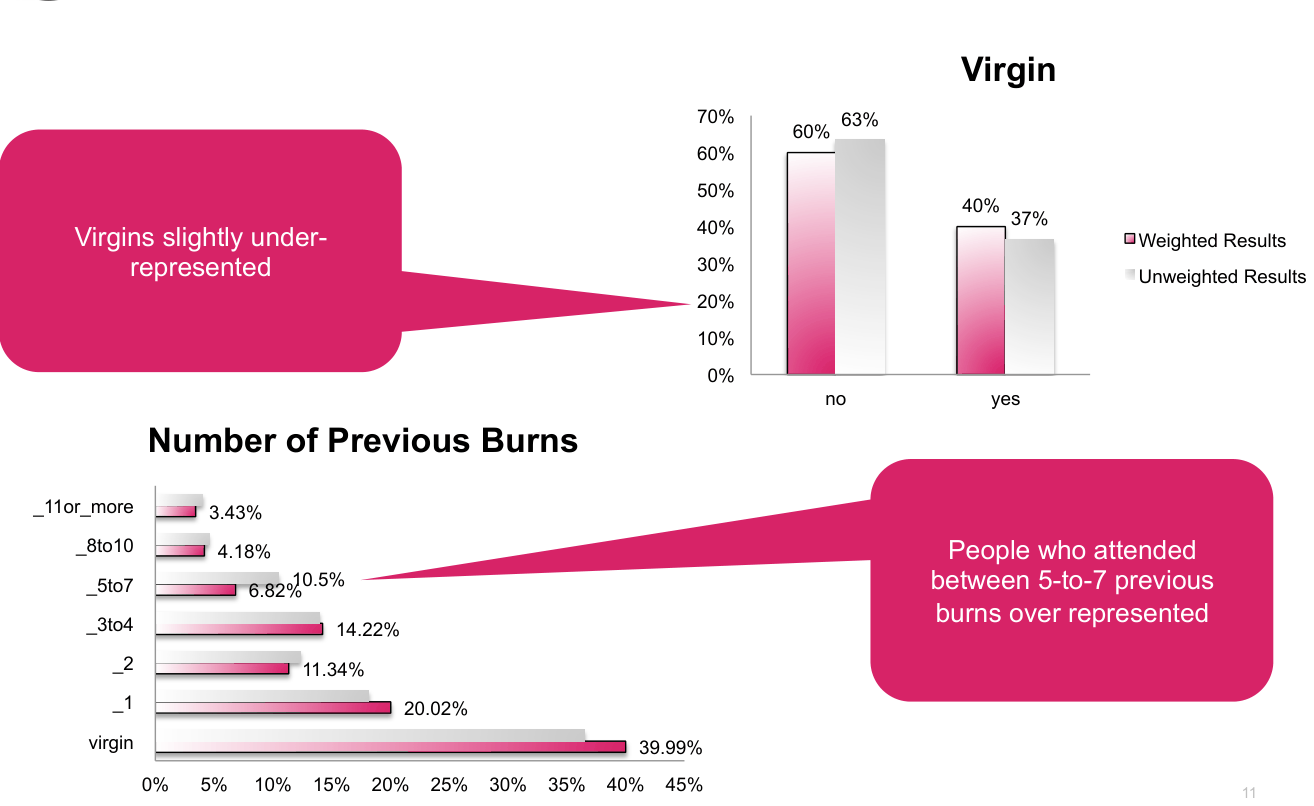
Virgin 70% 63% 60% 60% 50% 40% 37% Virgins slightly under- 40% Weighted Results represented 30% Unweighted Results 20% 10% 0% no yes Number of Previous Burns _11or_more 3.43% _8to10 People who attended 4.18% between 5-to-7 previous 10.5% _5to7 6.82% burns over represented _3to4 14.22% _2 11.34% _1 20.02% virgin 39.99% 0% 5% 10% 15% 20% 25% 30% 35% 40% 45%
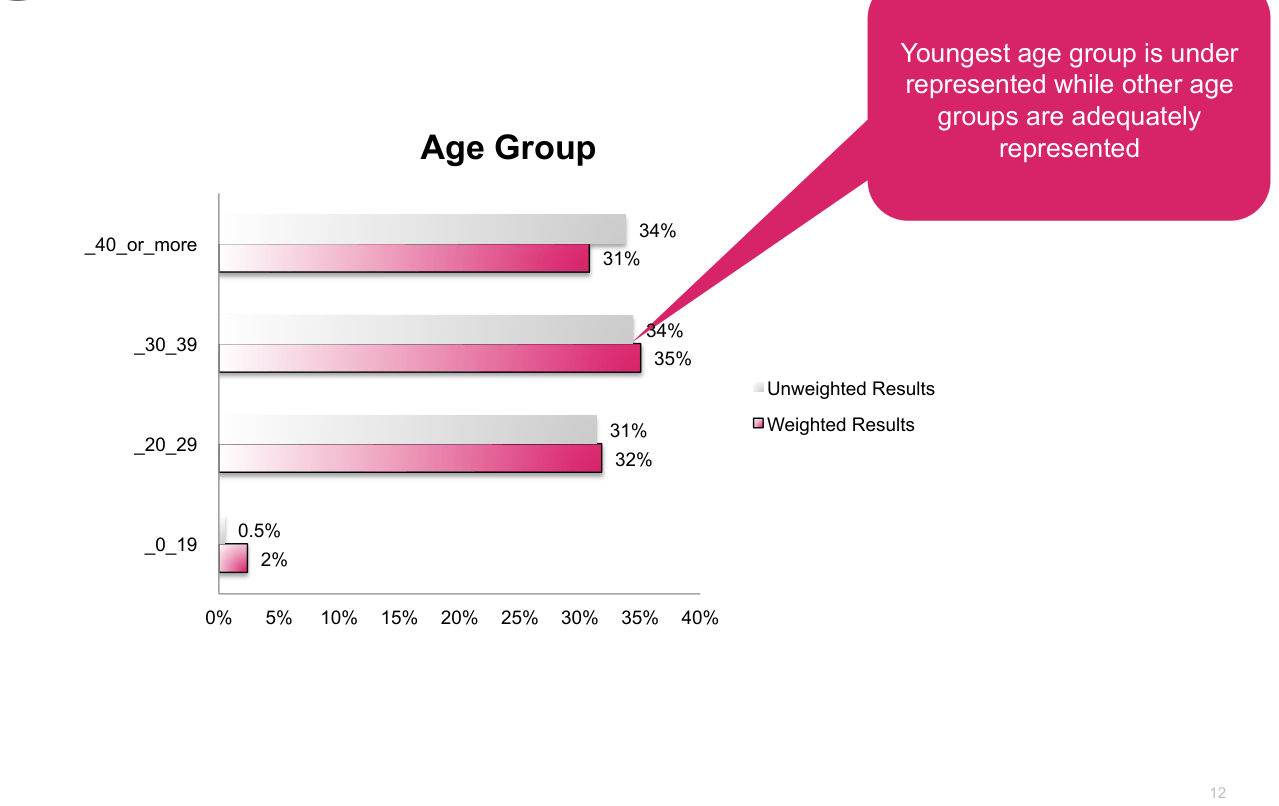
Youngest age group is under represented while other age groups are adequately Age Group represented 34% _40_or_more 31% 34% _30_39 35% Unweighted Results Weighted Results 31% _20_29 32% 0.5% _0_19 2% 0% 5% 10% 15% 20% 25% 30% 35% 40%
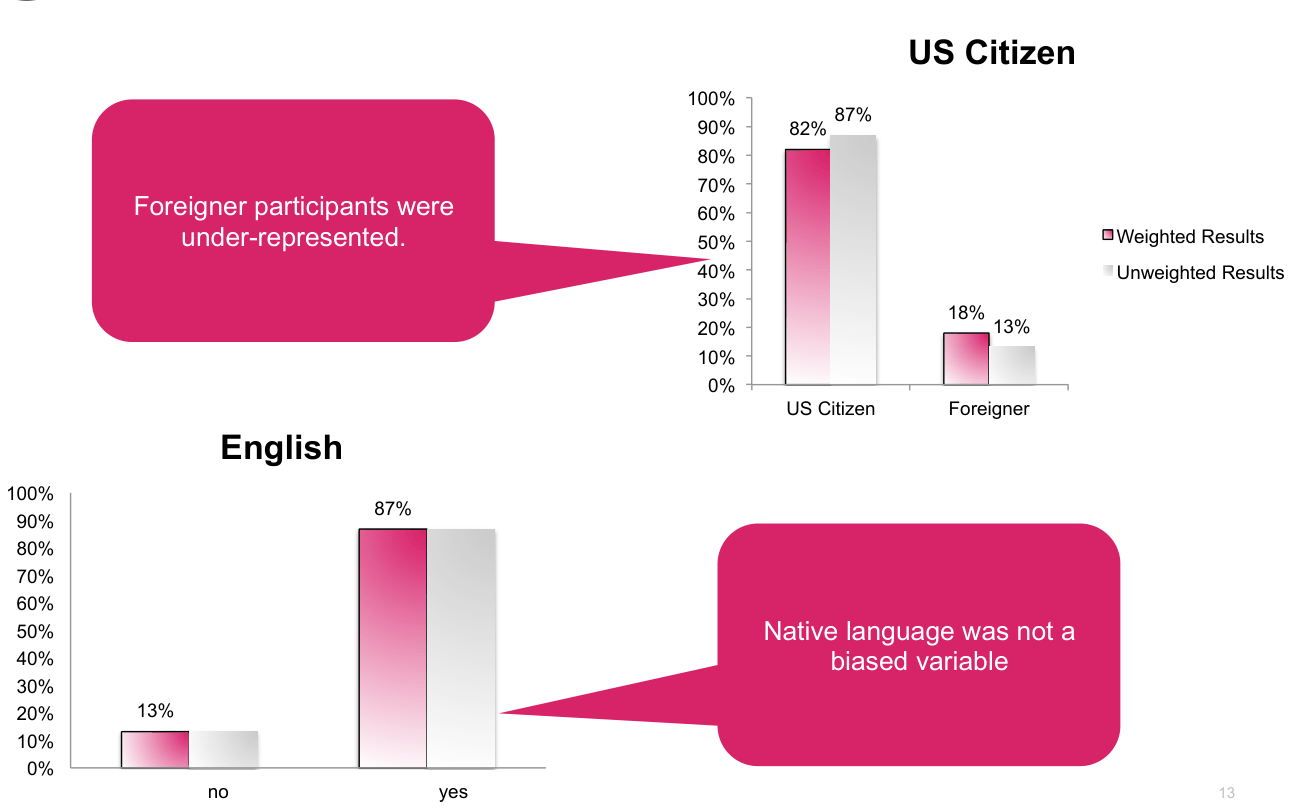
US Citizen 100% 87% 90% 82% 80% 70% Foreigner participants were 60% under-represented. Weighted Results 50% 40% Unweighted Results 30% 18% 20% 13% 10% 0% US Citizen Foreigner English 100% 87% 90% 80% 70% 60% Native language was not a 50% biased variable 40% 30% 20% 13% 10% 0% no yes

Sociodemographic Characteristics

Sociodemographic Characteristics
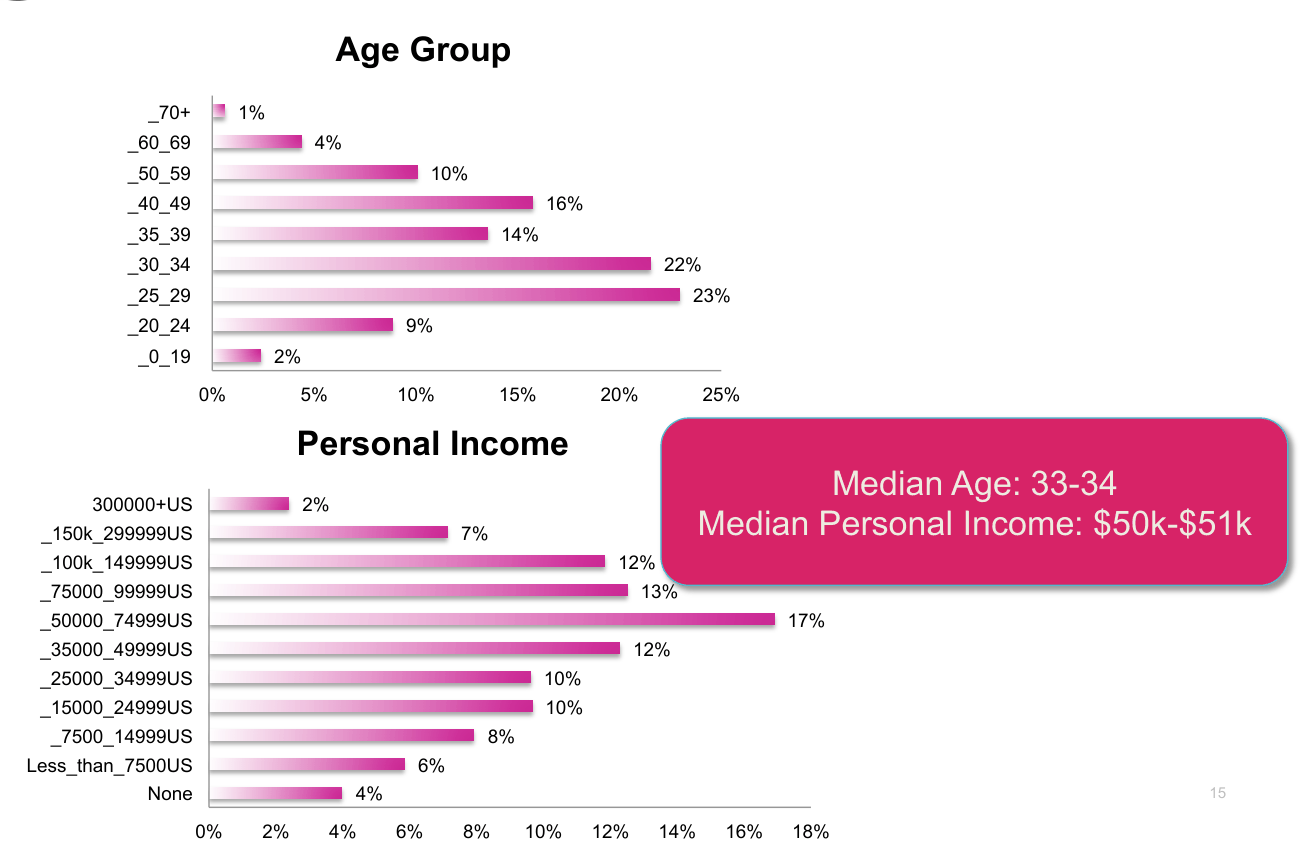
Age Group _70+ 1% _60_69 4% _50_59 10% _40_49 16% _35_39 14% _30_34 22% _25_29 23% _20_24 9% _0_19 2% 0% 5% 10% 15% 20% 25% Personal Income Median Age: 33-34 300000+US 2% Median Personal Income: $50k-$51k _150k_299999US 7% _100k_149999US 12% _75000_99999US 13% _50000_74999US 17% _35000_49999US 12% _25000_34999US 10% _15000_24999US 10% _7500_14999US 8% Less_than_7500US 6% None 4% 0% 2% 4% 6% 8% 10% 12% 14% 16% 18%
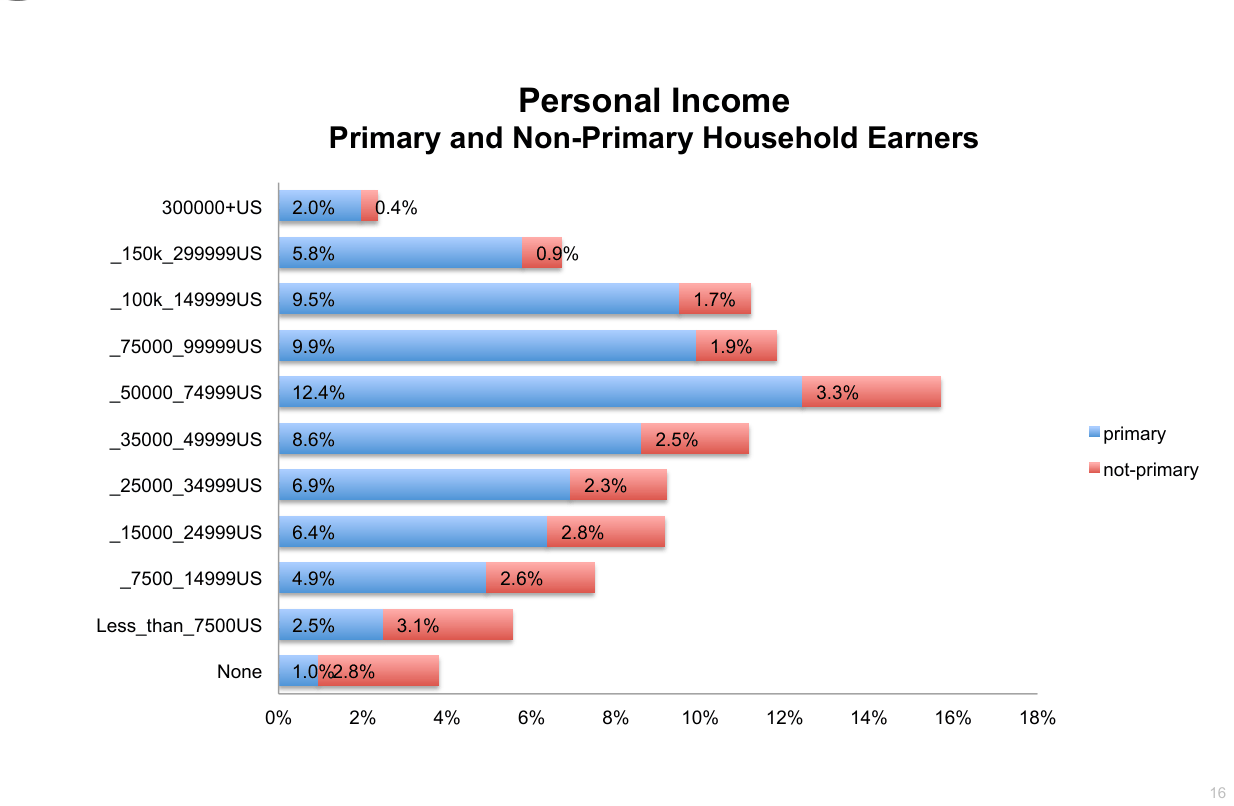
Personal Income Primary and Non-Primary Household Earners 300000+US 2.0% 0.4% _150k_299999US 5.8% 0.9% _100k_149999US 9.5% 1.7% _75000_99999US 9.9% 1.9% _50000_74999US 12.4% 3.3% primary _35000_49999US 8.6% 2.5% not-primary _25000_34999US 6.9% 2.3% _15000_24999US 6.4% 2.8% _7500_14999US 4.9% 2.6% Less_than_7500US 2.5% 3.1% None 1.0% 2.8% 0% 2% 4% 6% 8% 10% 12% 14% 16% 18%
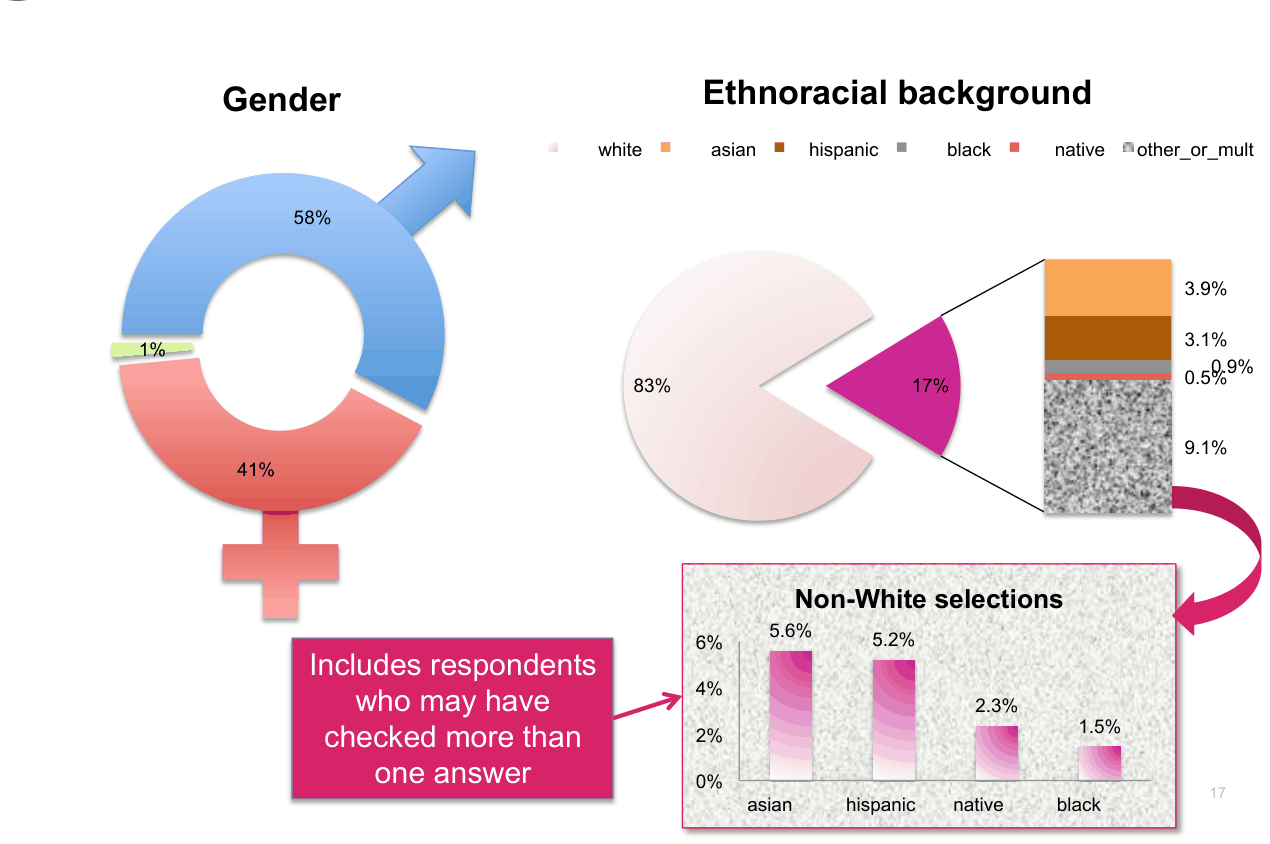
Ethnoracial background Gender white asian hispanic black native other_or_mult 58% 3.9% 3.1% 1% 0.9% 0.5% 83% 17% 9.1% 41% Non-White selections 5.6% 5.2% 6% Includes respondents 4% who may have 2.3% 1.5% checked more than 2% one answer 0% asian hispanic native black
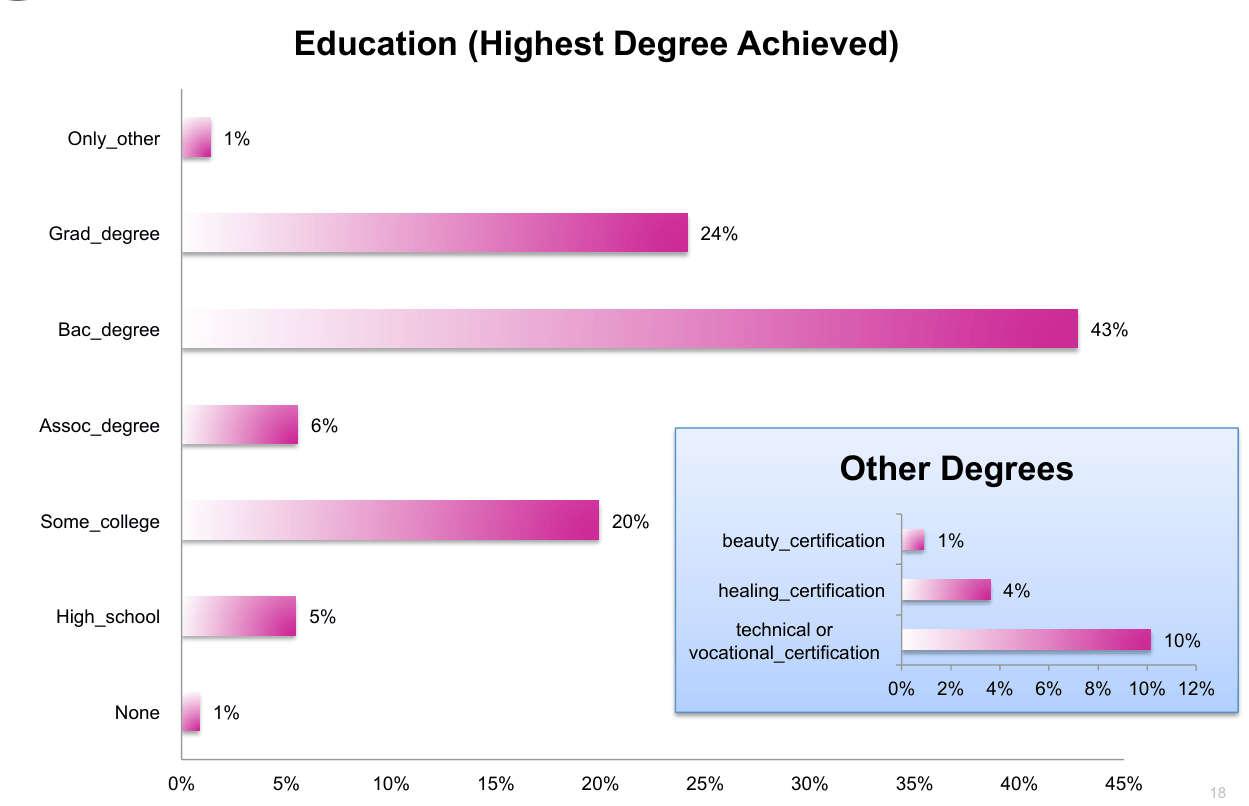
Education (Highest Degree Achieved) Only_other 1% Grad_degree 24% Bac_degree 43% Assoc_degree 6% Other Degrees Some_college 20% beauty_certification 1% healing_certification 4% High_school 5% technical or 10% vocational_certification 0% 2% 4% 6% 8% 10% 12% None 1% 0% 5% 10% 15% 20% 25% 30% 35% 40% 45%

Sociodemographic Characteristics (USA)
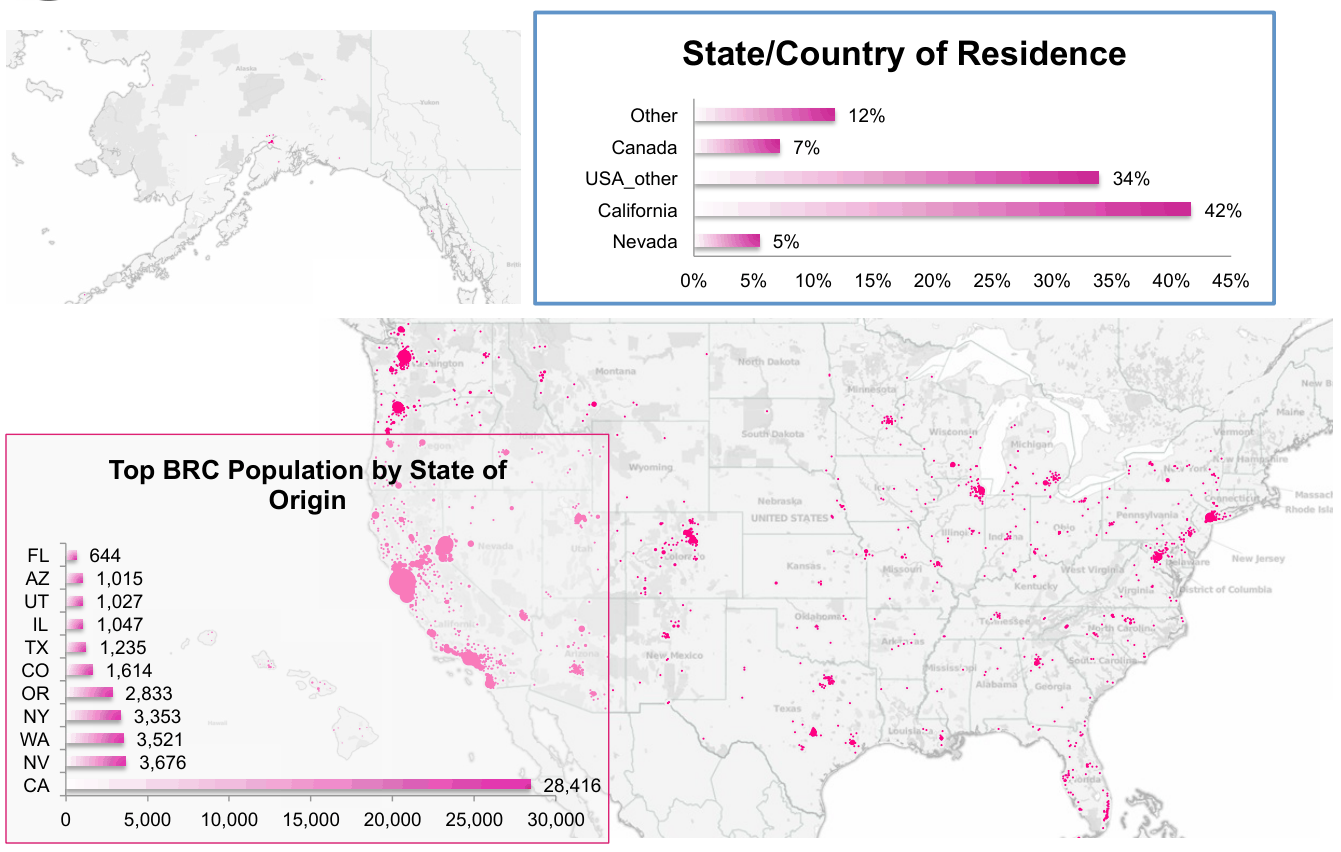
State/Country of Residence Other 12% Canada 7% USA_other 34% California 42% Nevada 5% 0% 5% 10% 15% 20% 25% 30% 35% 40% 45% Top BRC Population by State of Origin FL 644 AZ 1,015 UT 1,027 IL 1,047 TX 1,235 CO 1,614 OR 2,833 NY 3,353 WA 3,521 NV 3,676 CA 28,416 0 5,000 10,000 15,000 20,000 25,000 30,000

Sociodemographic Characteristics

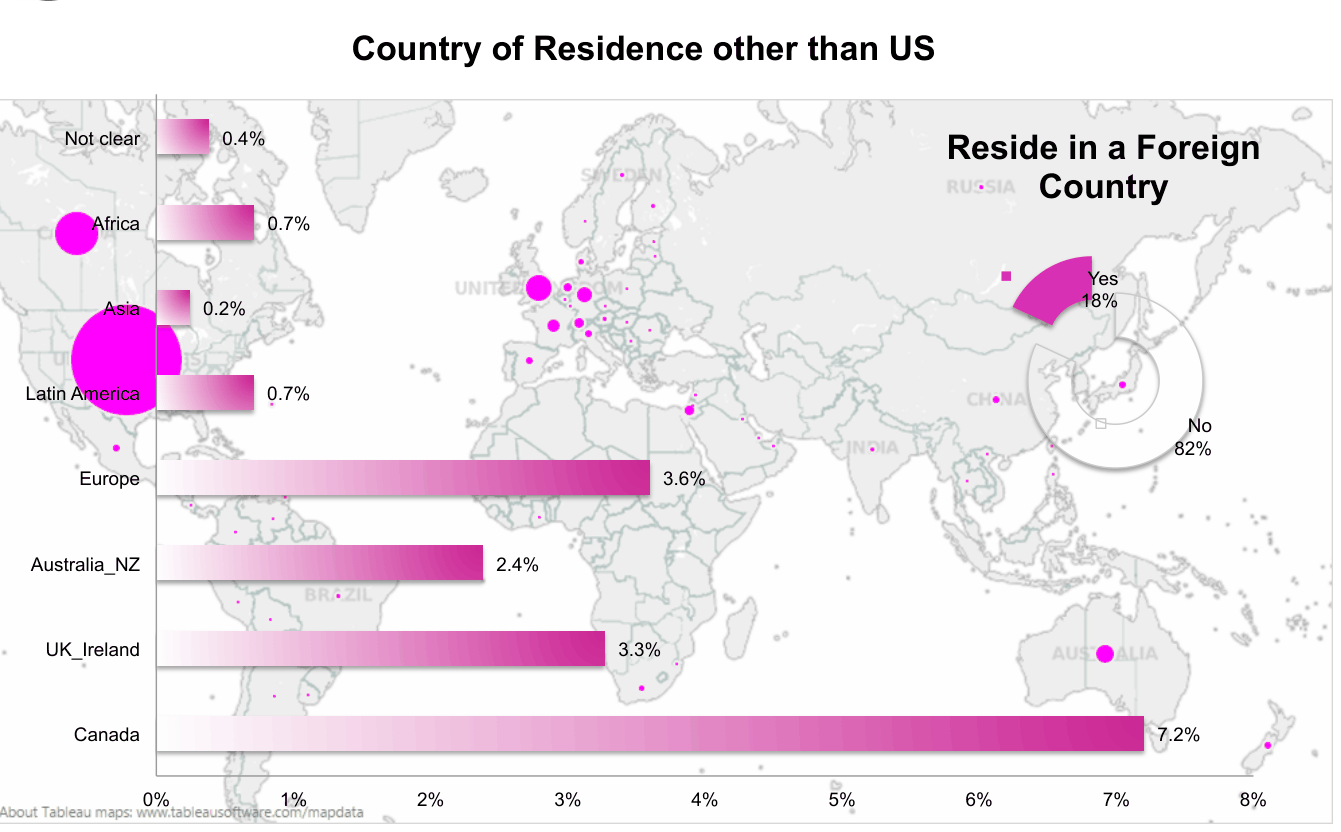
Country of Residence other than US Not clear 0.4% Reside in a Foreign Country Africa 0.7% Yes 18% Asia 0.2% Latin America 0.7% No 82% Europe 3.6% Australia_NZ 2.4% UK_Ireland 3.3% Canada 7.2% 0% 1% 2% 3% 4% 5% 6% 7% 8%
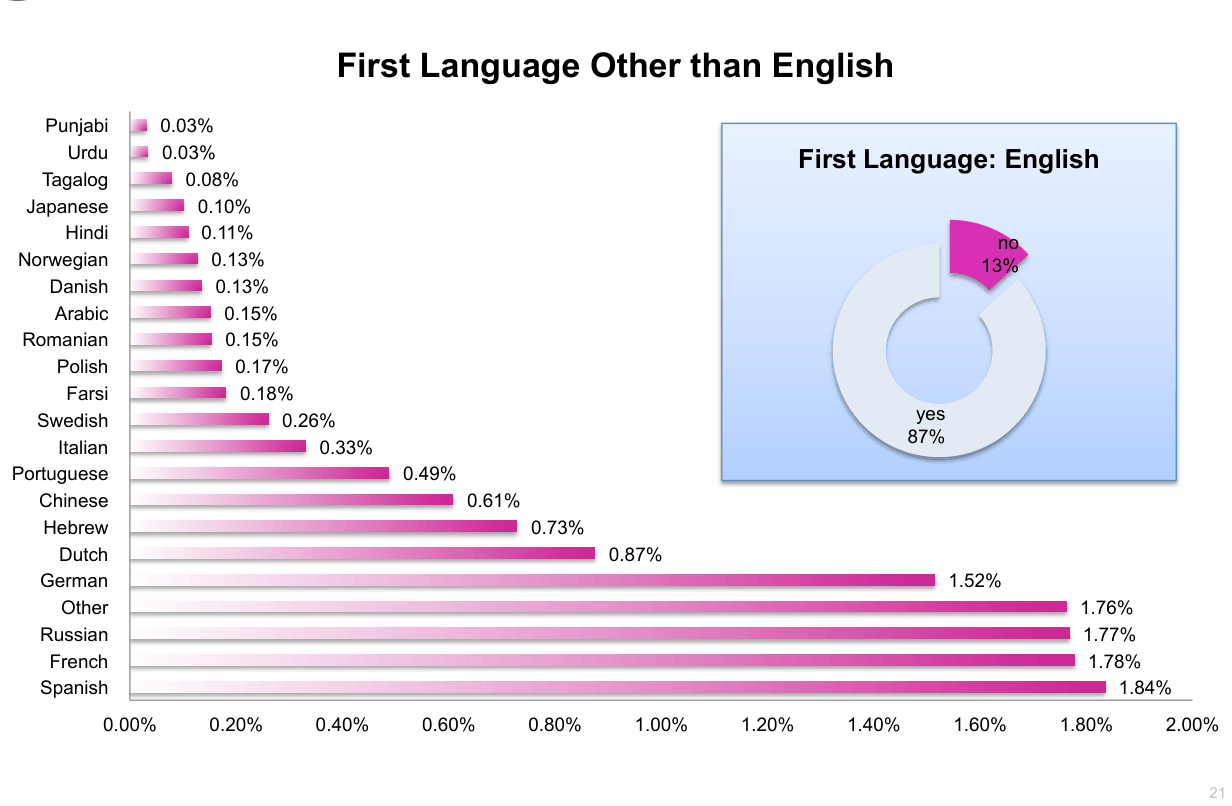
First Language Other than English Punjabi 0.03% Urdu 0.03% First Language: English Tagalog 0.08% Japanese 0.10% Hindi 0.11% no Norwegian 0.13% 13% Danish 0.13% Arabic 0.15% Romanian 0.15% Polish 0.17% Farsi 0.18% yes Swedish 0.26% 87% Italian 0.33% Portuguese 0.49% Chinese 0.61% Hebrew 0.73% Dutch 0.87% German 1.52% Other 1.76% Russian 1.77% French 1.78% Spanish 1.84% 0.00% 0.20% 0.40% 0.60% 0.80% 1.00% 1.20% 1.40% 1.60% 1.80% 2.00%
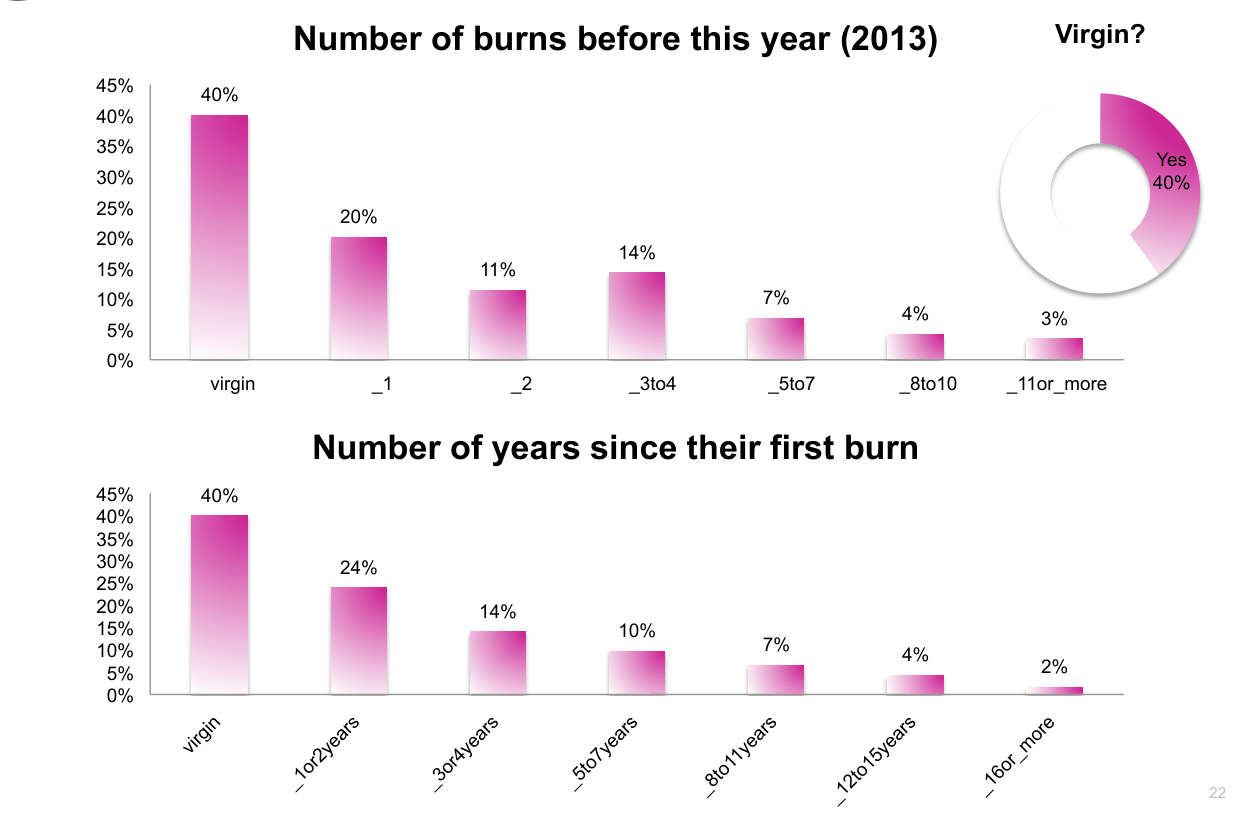
Number of burns before this year (2013) Virgin? 45% 40% 40% 35% Yes 30% 40% 25% 20% 20% 14% 15% 11% 10% 7% 4% 3% 5% 0% virgin _1 _2 _3to4 _5to7 _8to10 _11or_more Number of years since their first burn 45% 40% 40% 35% 30% 24% 25% 20% 14% 15% 10% 7% 10% 4% 2% 5% 0%

Life at Burning Man

Life at Burning Man
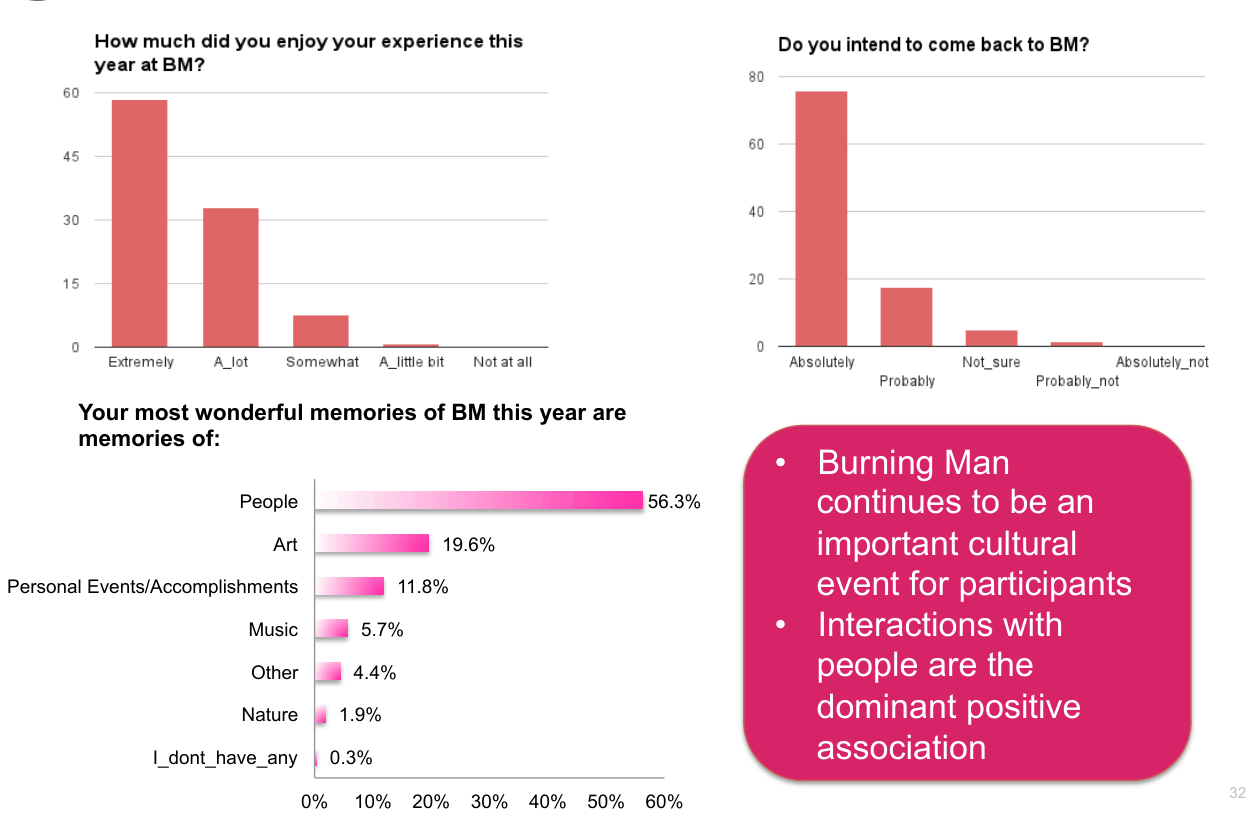
Your most wonderful memories of BM this year are memories of: • Burning Man continues to be an People 56.3% important cultural Art 19.6% event for participants Personal Events/Accomplishments 11.8% • Interactions with Music 5.7% people are the Other 4.4% dominant positive Nature 1.9% association I_dont_have_any 0.3% 0% 10% 20% 30% 40% 50% 60%
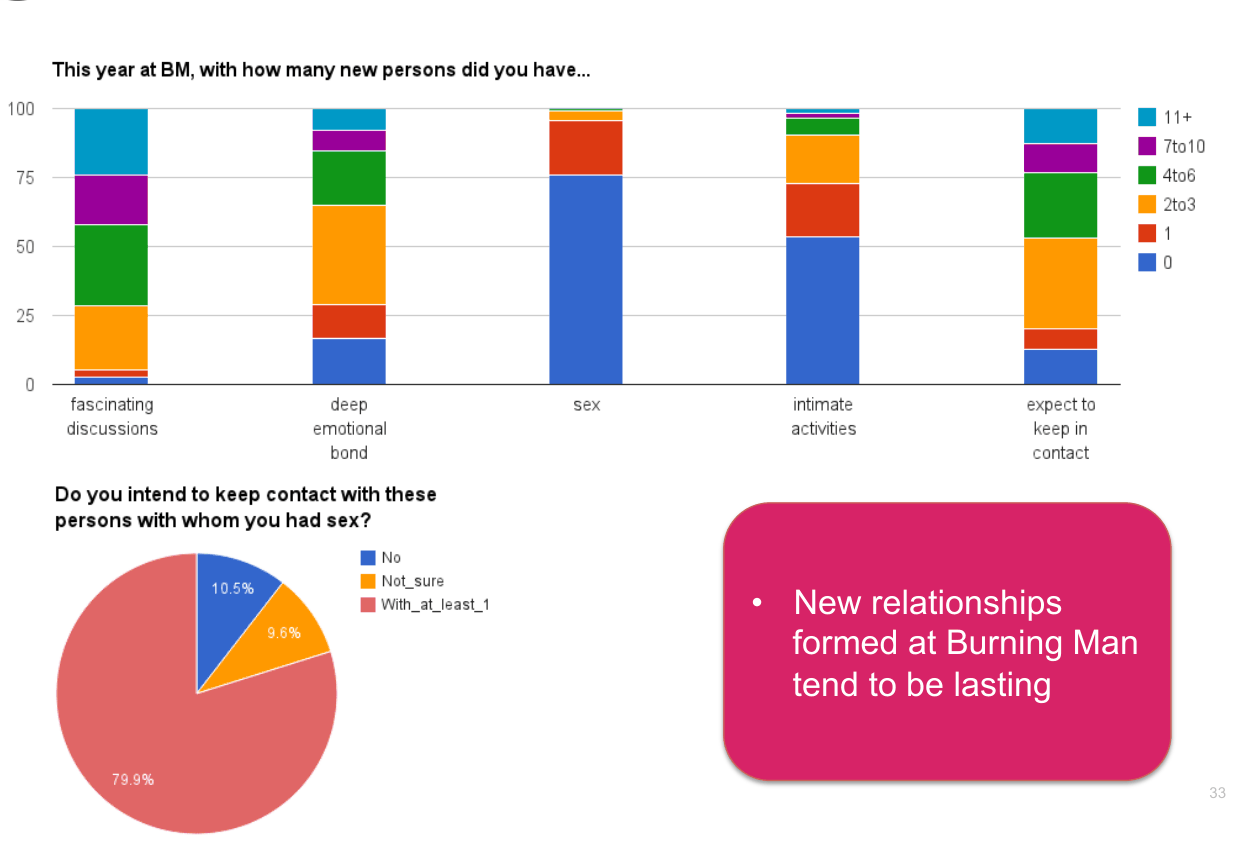
• New relationships formed at Burning Man tend to be lasting
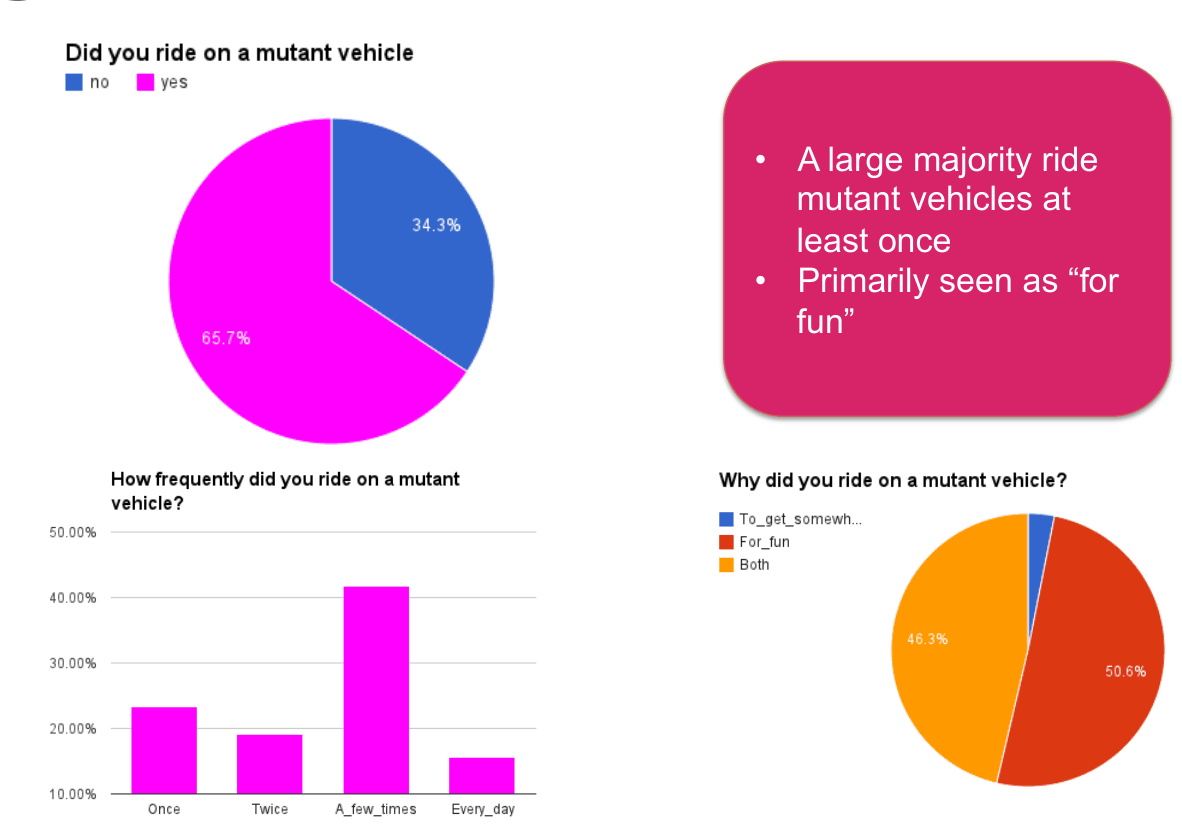
• A large majority ride mutant vehicles at least once • Primarily seen as “for fun”
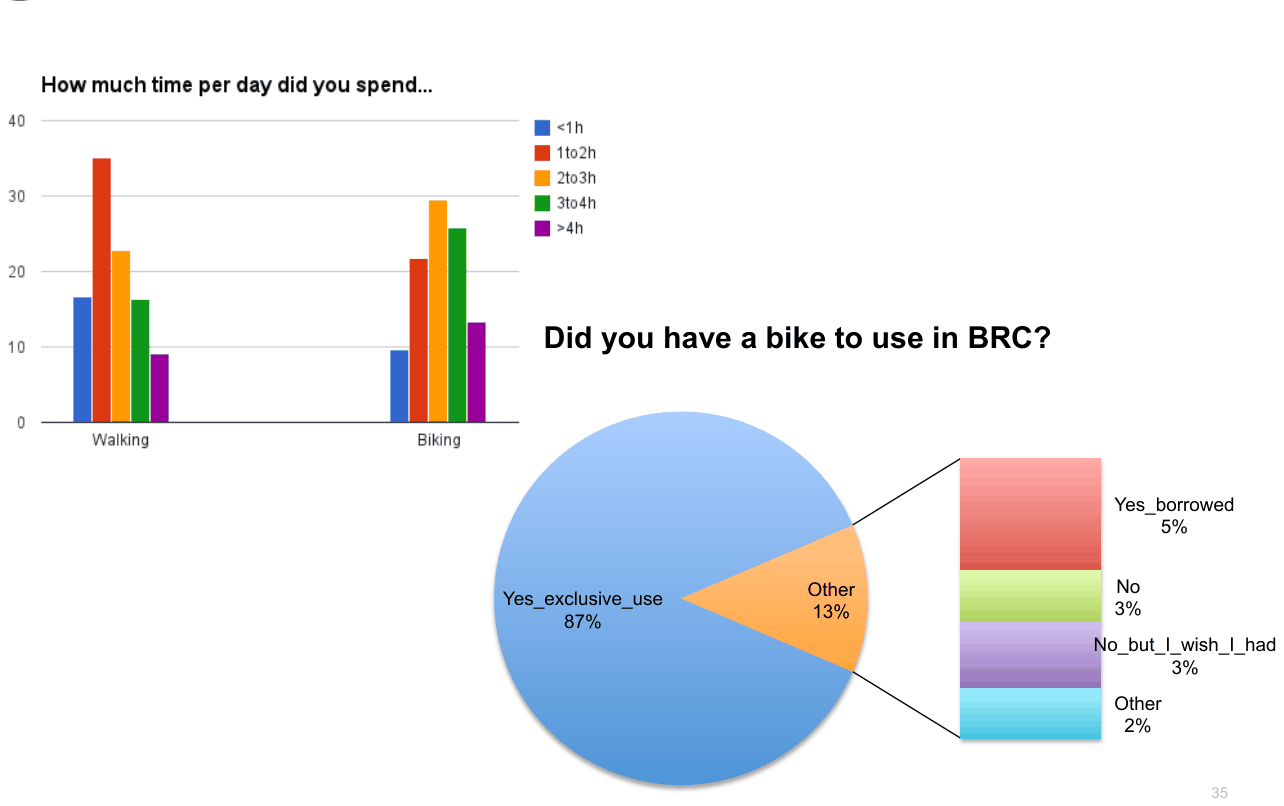
Did you have a bike to use in BRC? Yes_borrowed 5% Other No Yes_exclusive_use 13% 3% 87% No_but_I_wish_I_had 3% Other 2%
Life at Burning Man
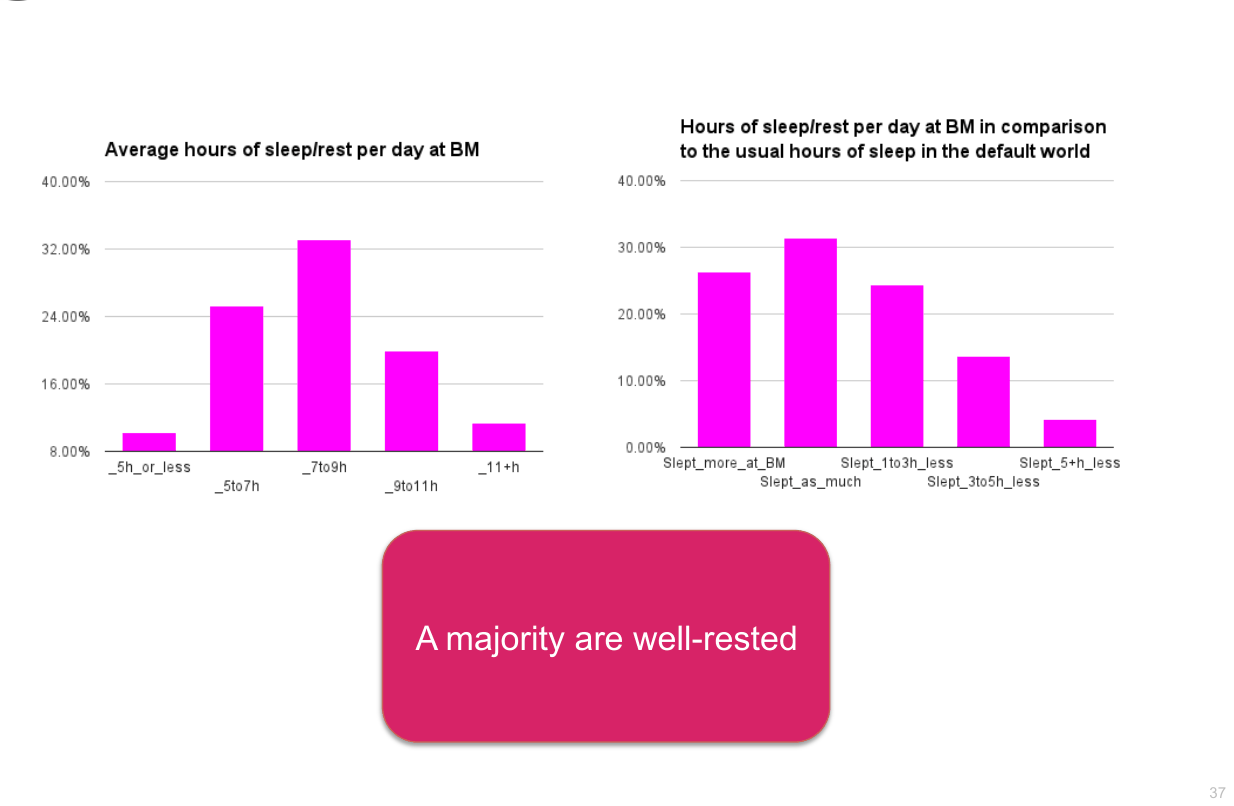
A majority are well-rested

Identity & Self

Identity & Self
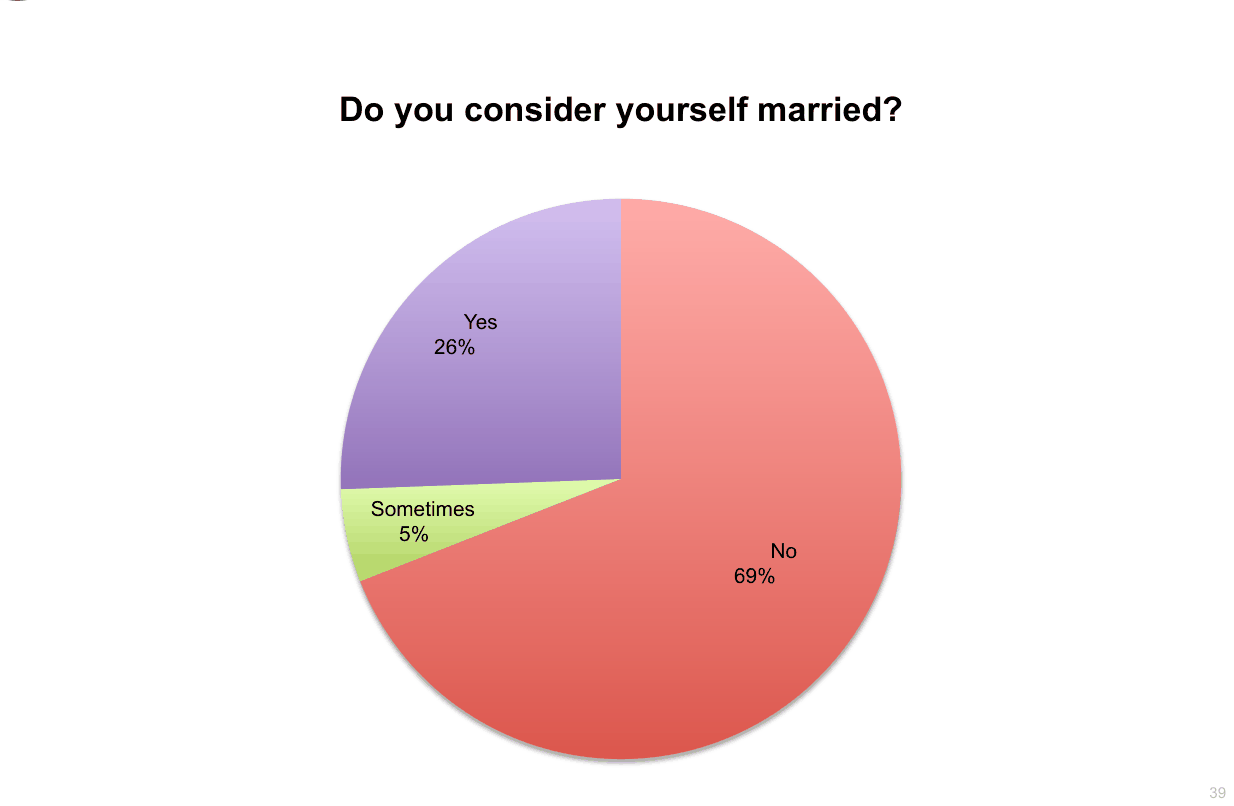
Do you consider yourself married? Yes 26% Sometimes 5% No 69%
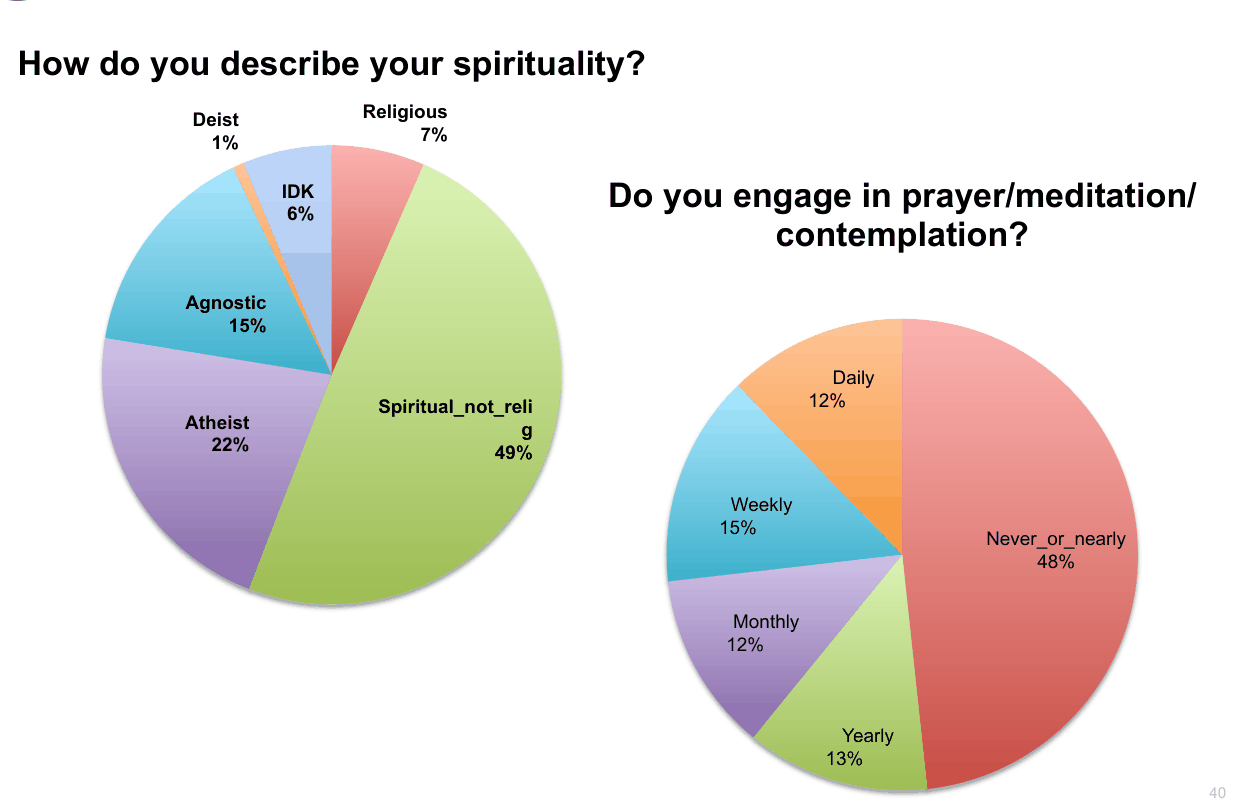
How do you describe your spirituality? Religious Deist 7% 1% Do you engage in prayer/meditation/ IDK 6% contemplation? Agnostic 15% Daily 12% Spiritual_not_reli Atheist g 22% 49% Weekly 15% Never_or_nearly 48% Monthly 12% Yearly 13%
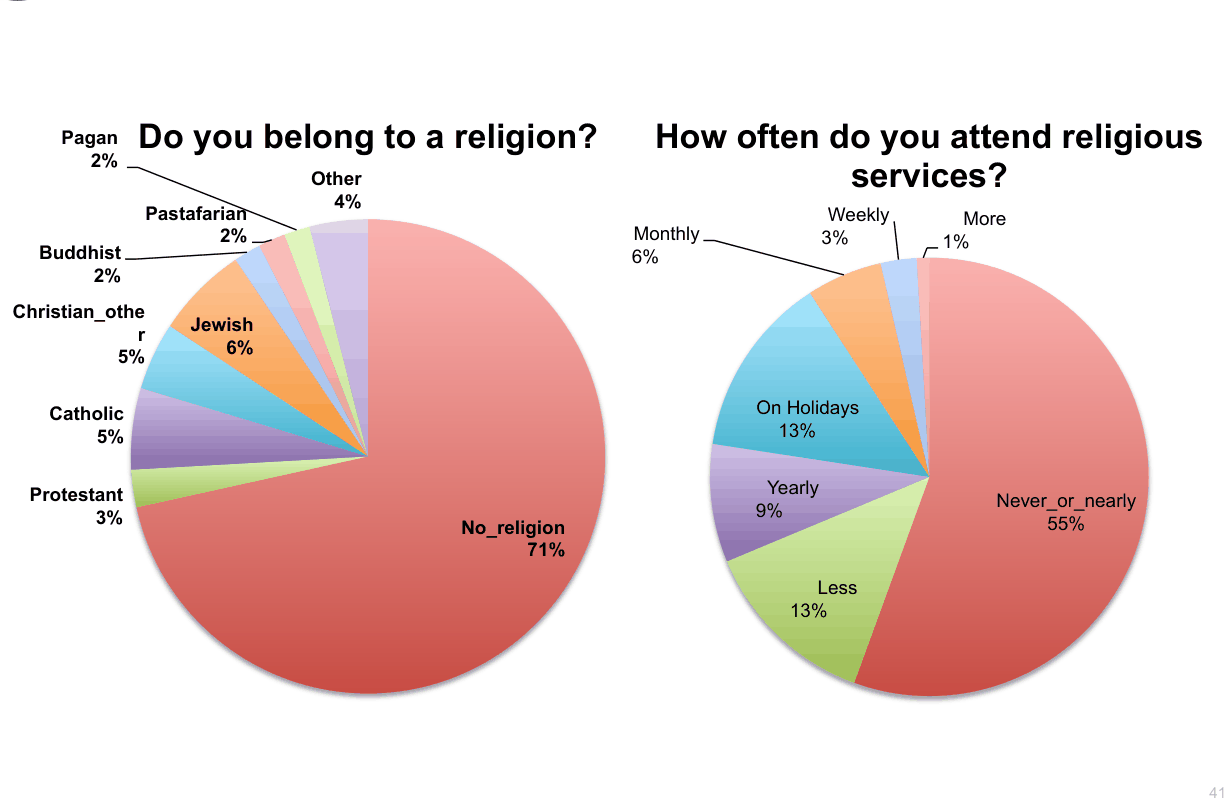
Do you belong to a religion? How often do you attend religious Pagan 2% services? Other 4% Pastafarian Weekly More 2% Monthly 3% 1% Buddhist 6% 2% Christian_othe Jewish r 6% 5% On Holidays Catholic 13% 5% Yearly Protestant Never_or_nearly 9% 3% No_religion 55% 71% Less 13%
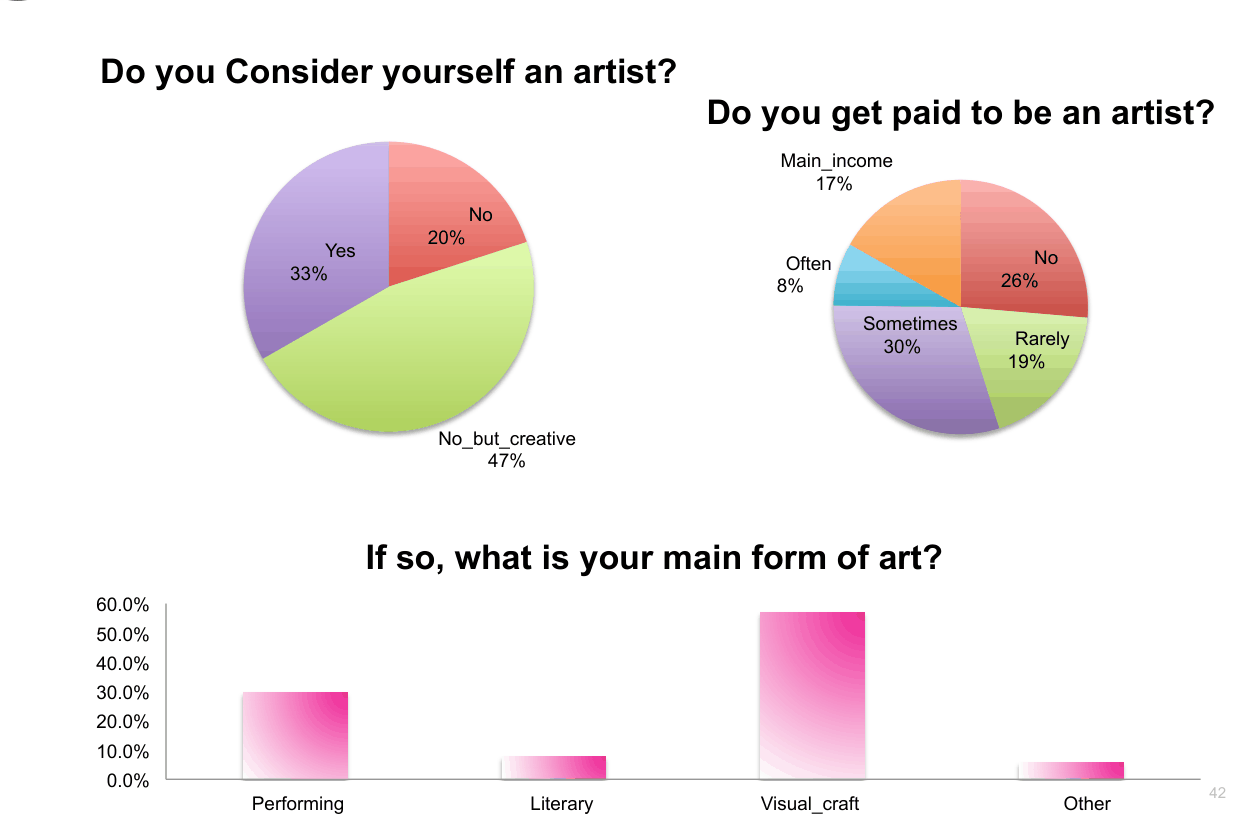
Do you Consider yourself an artist? Do you get paid to be an artist? Main_income 17% No 20% Yes No Often 33% 26% 8% Sometimes Rarely 30% 19% No_but_creative 47% If so, what is your main form of art? 60.0% 50.0% 40.0% 30.0% 20.0% 10.0% 0.0% Performing Literary Visual_craft Other
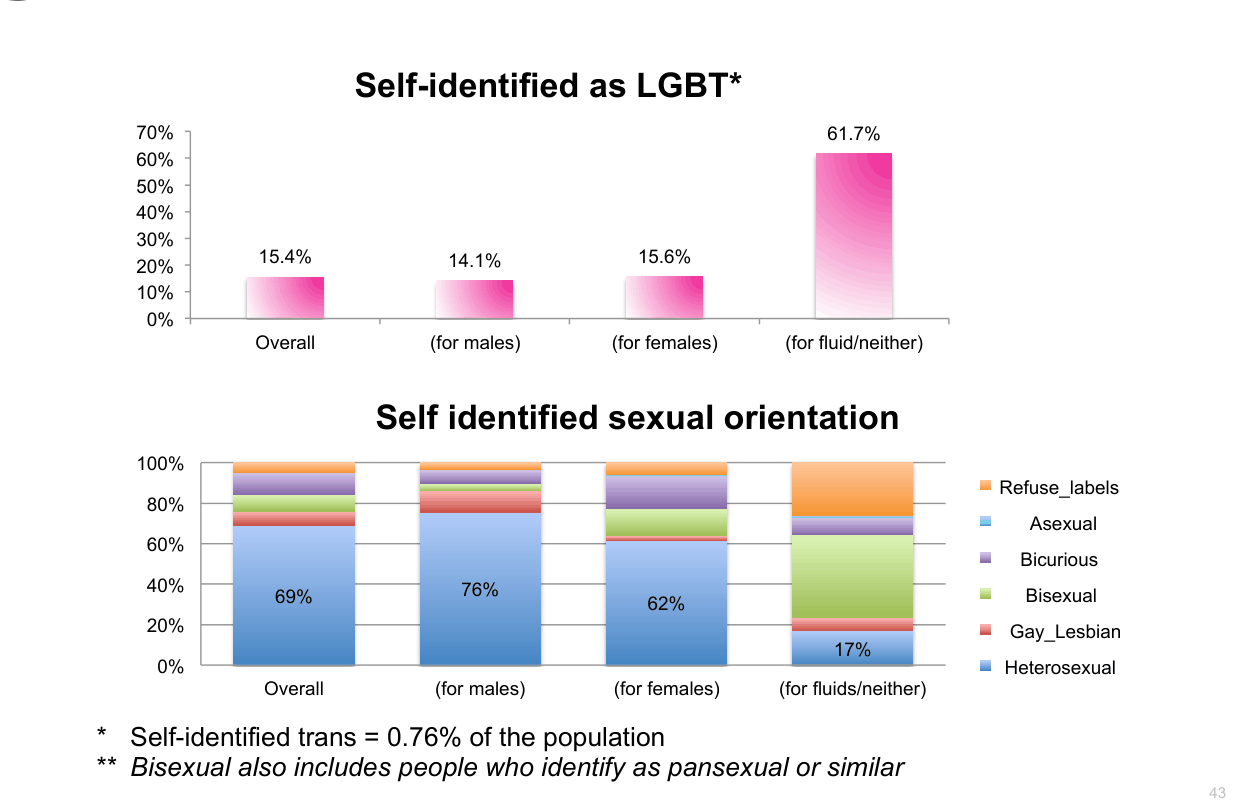
Self-identified as LGBT* 70% 61.7% 60% 50% 40% 30% 15.4% 14.1% 15.6% 20% 10% 0% Overall (for males) (for females) (for fluid/neither) Self identified sexual orientation 100% Refuse_labels 80% Asexual 60% Bicurious 40% 76% Bisexual 69% 62% 20% Gay_Lesbian 17% 0% Heterosexual Overall (for males) (for females) (for fluids/neither) * Self-identified trans = 0.76% of the population ** Bisexual also includes people who identify as pansexual or similar
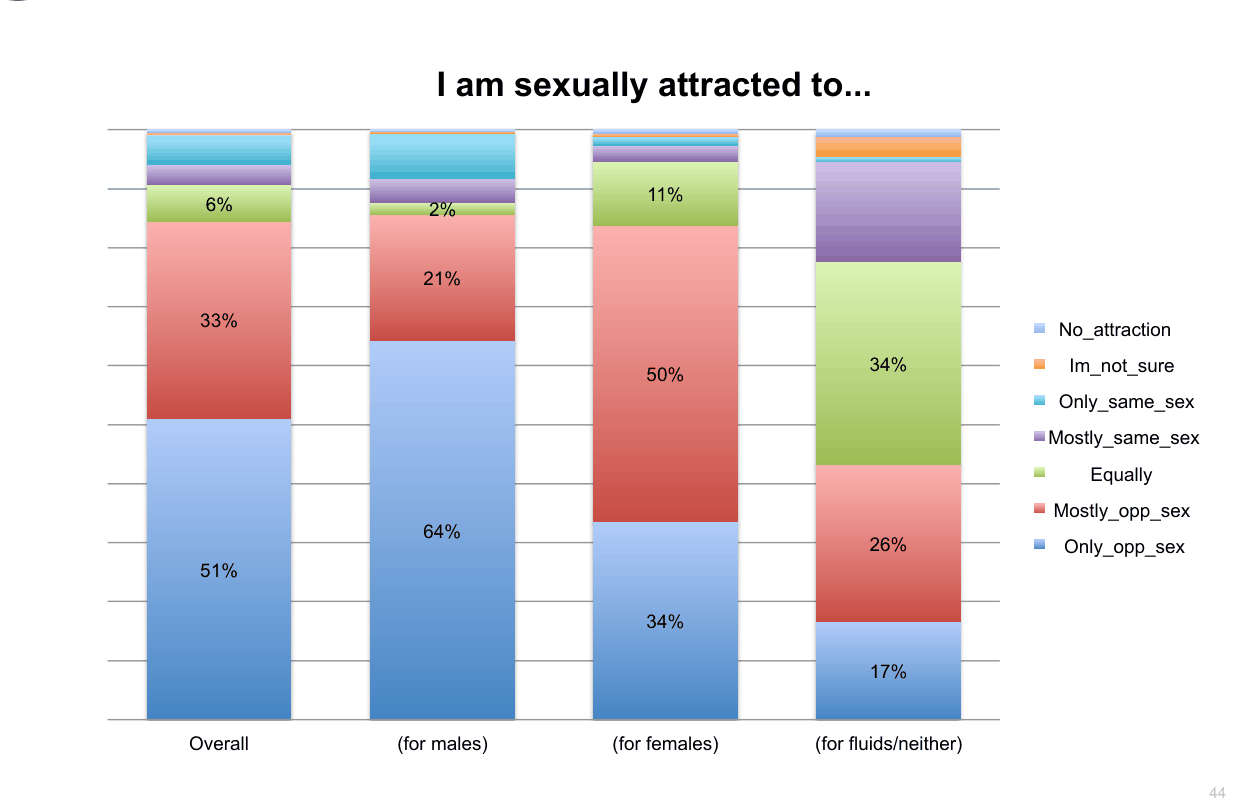
I am sexually attracted to... 11% 6% 2% 21% 33% No_attraction 34% Im_not_sure 50% Only_same_sex Mostly_same_sex Equally Mostly_opp_sex 64% 26% Only_opp_sex 51% 34% 17% Overall (for males) (for females) (for fluids/neither)
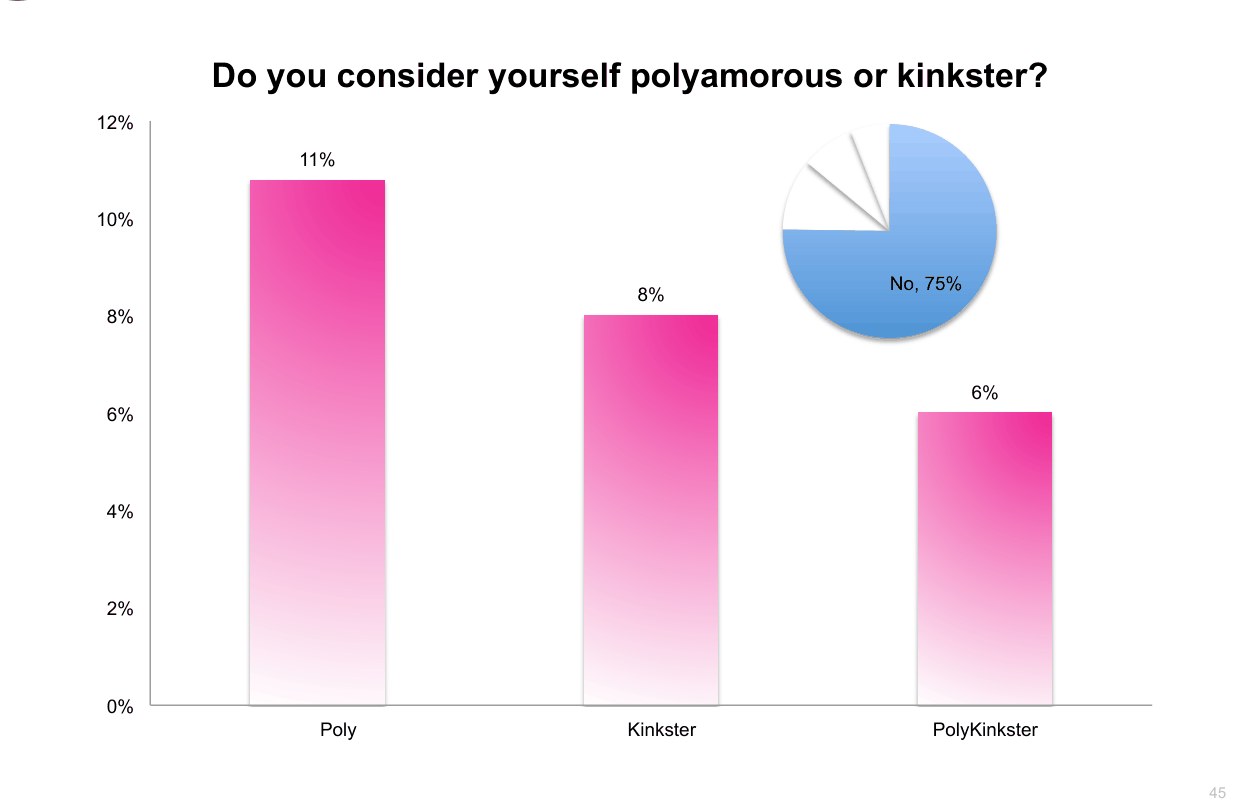
Do you consider yourself polyamorous or kinkster? 12% 11% 10% No, 75% 8% 8% 6% 6% 4% 2% 0% Poly Kinkster PolyKinkster

Burning Man in the Default World

Burning Man in the Default World
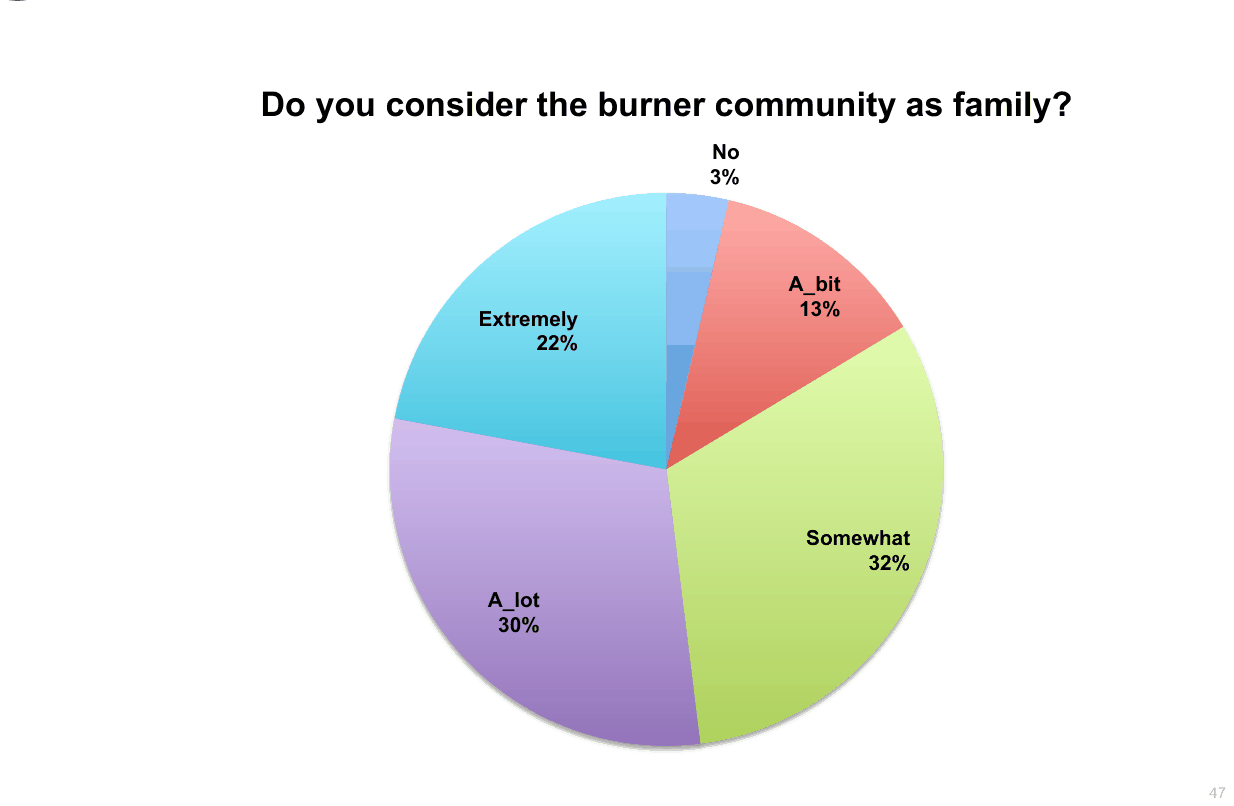
Do you consider the burner community as family? No 3% A_bit 13% Extremely 22% Somewhat 32% A_lot 30%
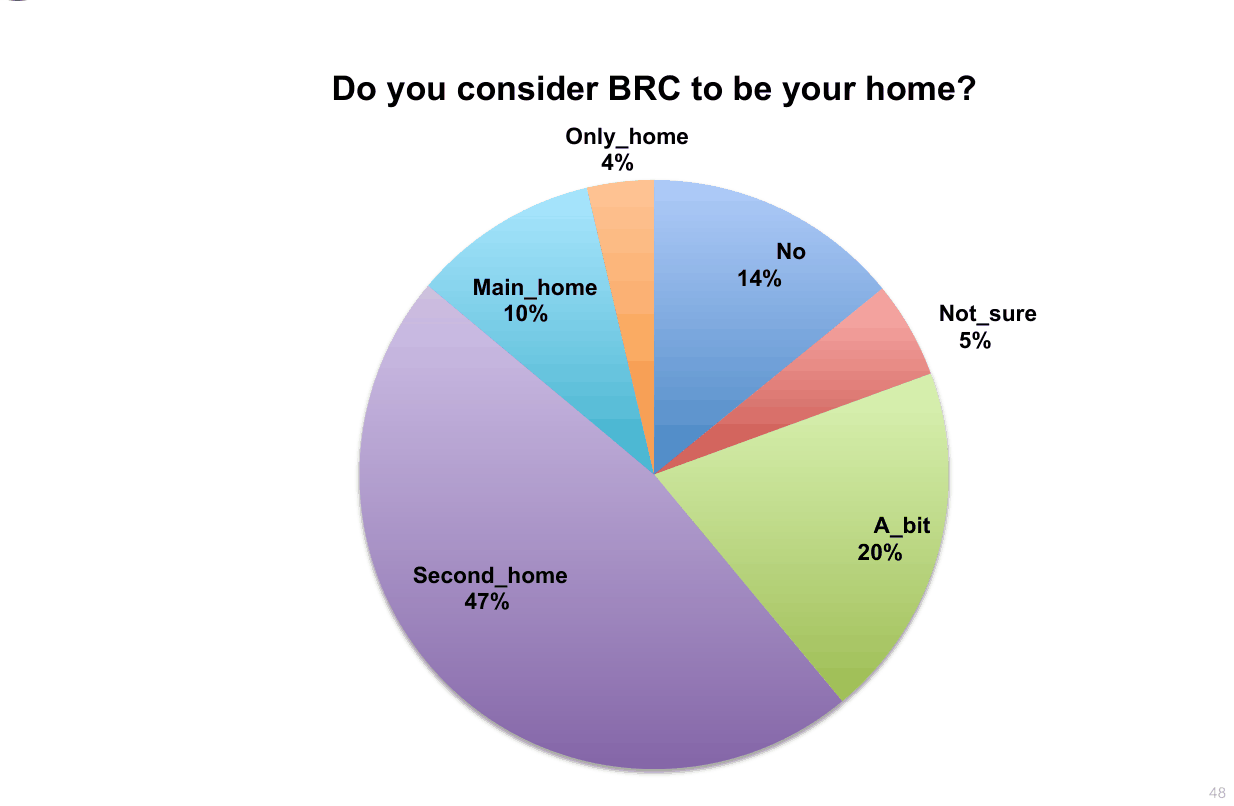
Do you consider BRC to be your home? Only_home 4% No 14% Main_home 10% Not_sure 5% A_bit 20% Second_home 47%
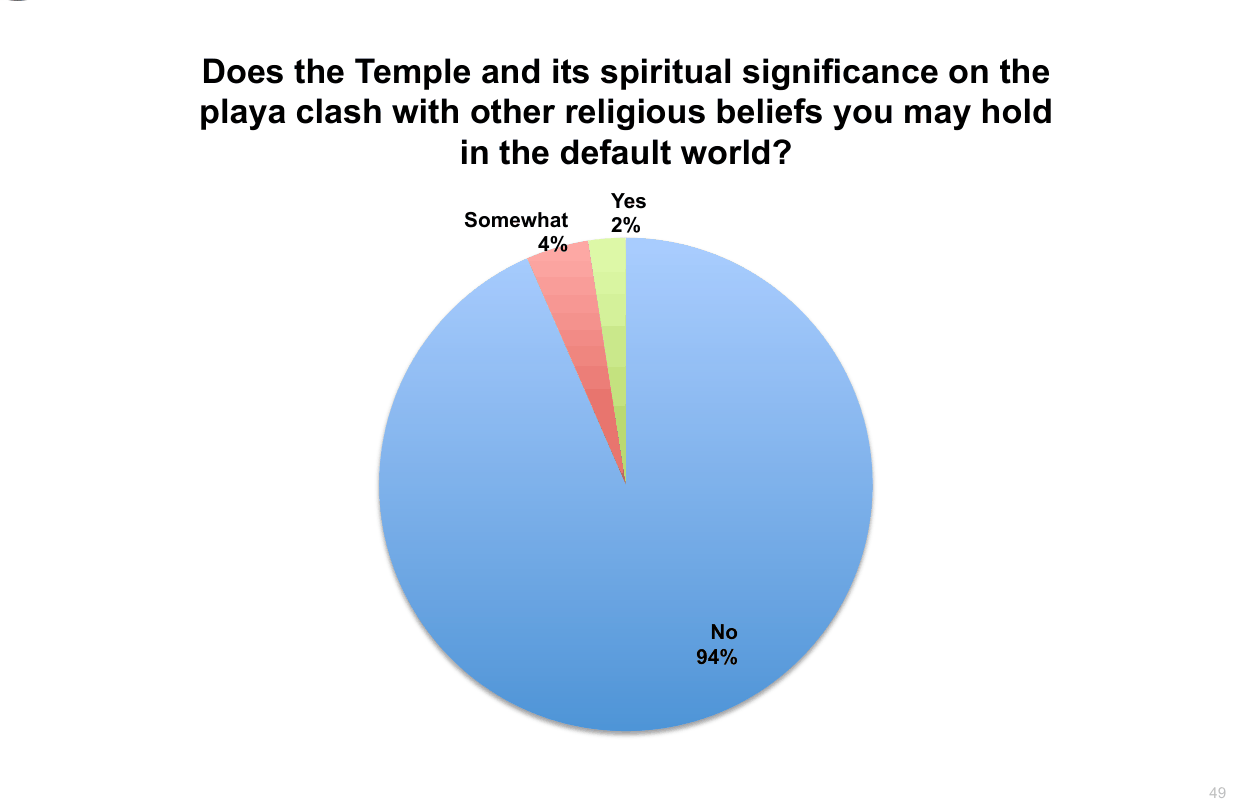
Does the Temple and its spiritual significance on the playa clash with other religious beliefs you may hold in the default world? Yes Somewhat 2% 4% No 94%
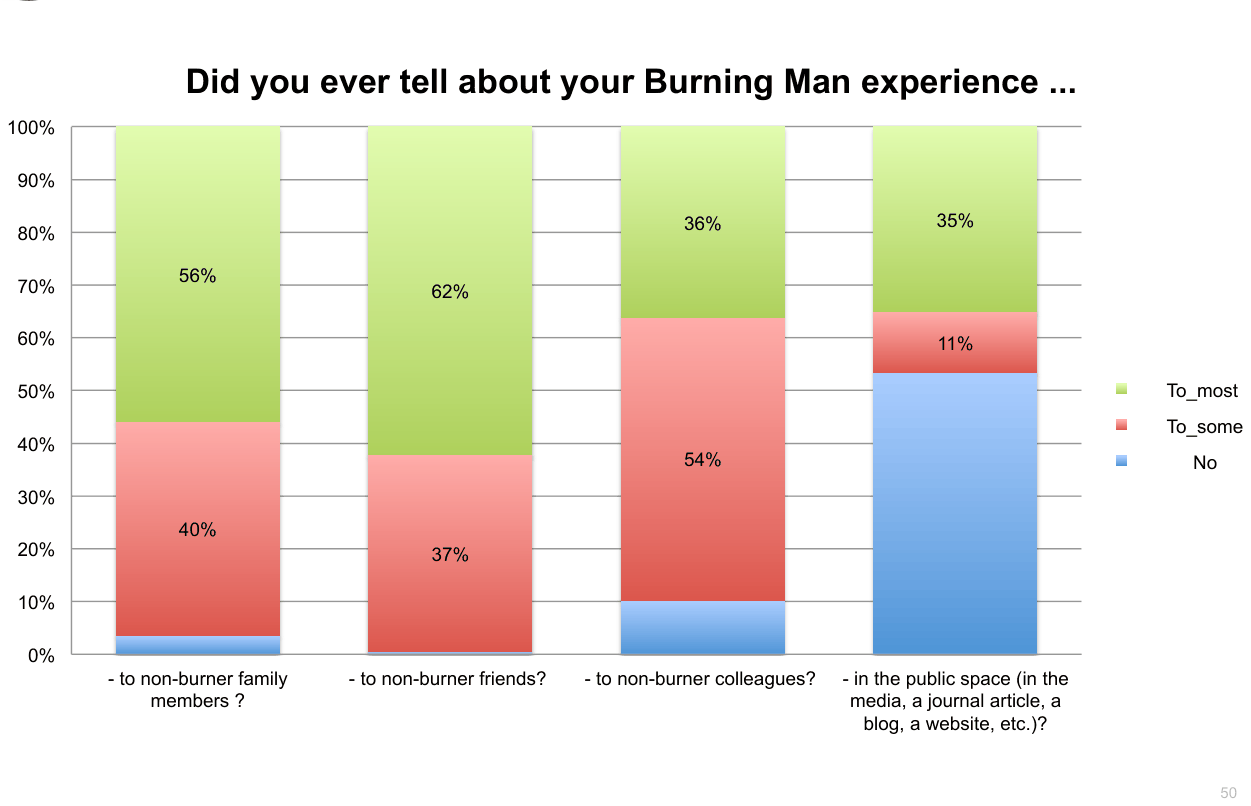
Did you ever tell about your Burning Man experience ... 100% 90% 35% 36% 80% 56% 70% 62% 60% 11% To_most 50% To_some 40% 54% No 30% 40% 20% 37% 10% 0% - to non-burner family - to non-burner friends? - to non-burner colleagues? - in the public space (in the members ? media, a journal article, a blog, a website, etc.)?
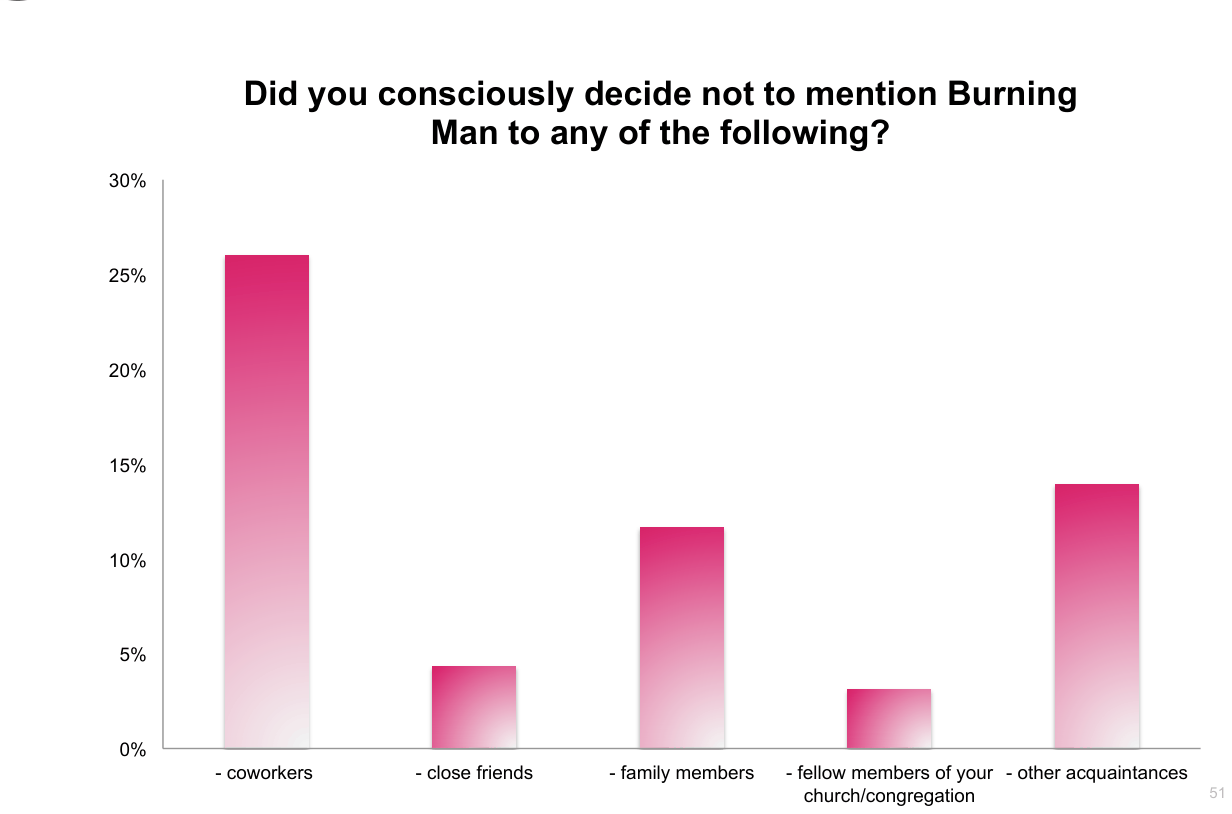
Did you consciously decide not to mention Burning Man to any of the following? 30% 25% 20% 15% 10% 5% 0% - coworkers - close friends - family members - fellow members of your - other acquaintances church/congregation
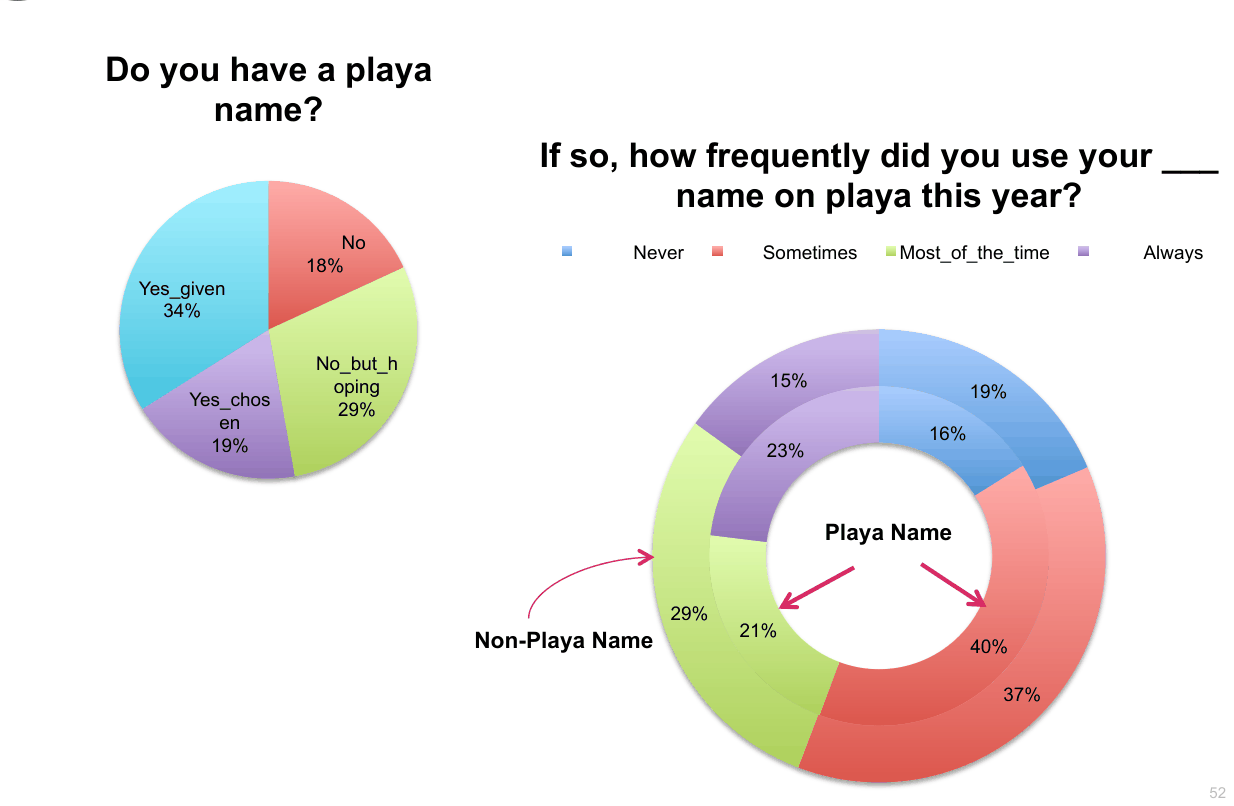
Do you have a playa name? If so, how frequently did you use your ___ name on playa this year? No Never Sometimes Most_of_the_time Always 18% Yes_given 34% No_but_h 15% oping 19% Yes_chos 29% en 16% 19% 23% Playa Name 29% 21% Non-Playa Name 40% 37%
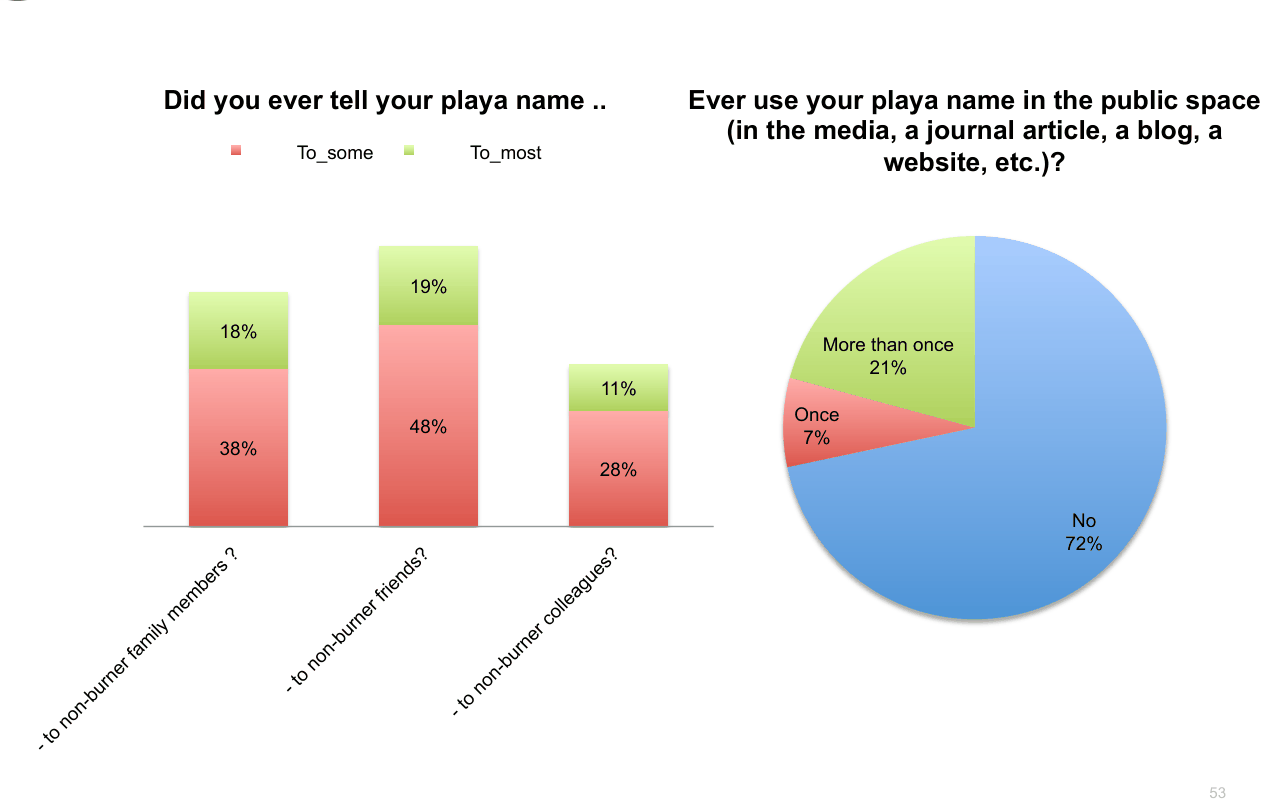
Did you ever tell your playa name .. Ever use your playa name in the public space (in the media, a journal article, a blog, a To_some To_most website, etc.)? 19% 18% More than once 21% 11% Once 48% 7% 38% 28% No 72%

Main Reasons to Go to Burning Man

Main Reasons to Go to Burning Man
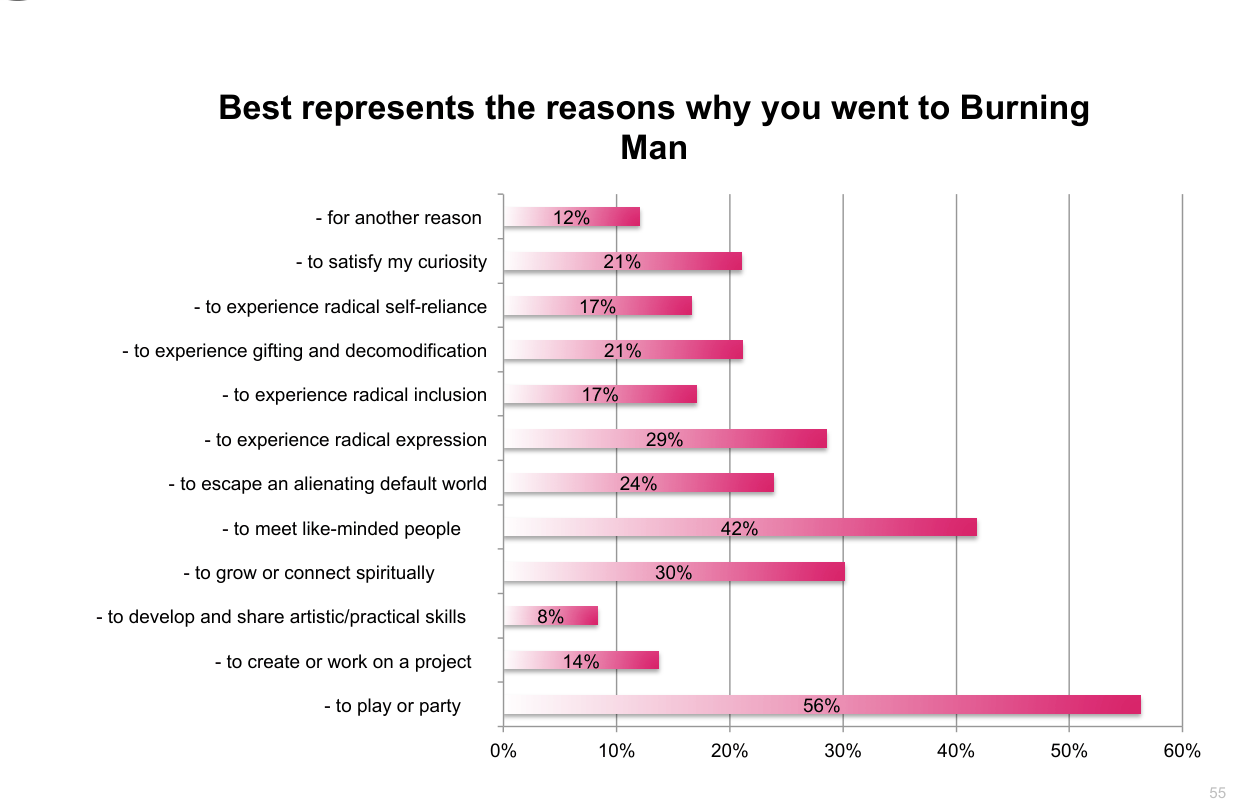
Best represents the reasons why you went to Burning Man - for another reason 12% - to satisfy my curiosity 21% - to experience radical self-reliance 17% - to experience gifting and decomodification 21% - to experience radical inclusion 17% - to experience radical expression 29% - to escape an alienating default world 24% - to meet like-minded people 42% - to grow or connect spiritually 30% - to develop and share artistic/practical skills 8% - to create or work on a project 14% - to play or party 56% 0% 10% 20% 30% 40% 50% 60%

Contributions and Acknowledgements

Contributions and Acknowledgements

Contributions and acknowledgements

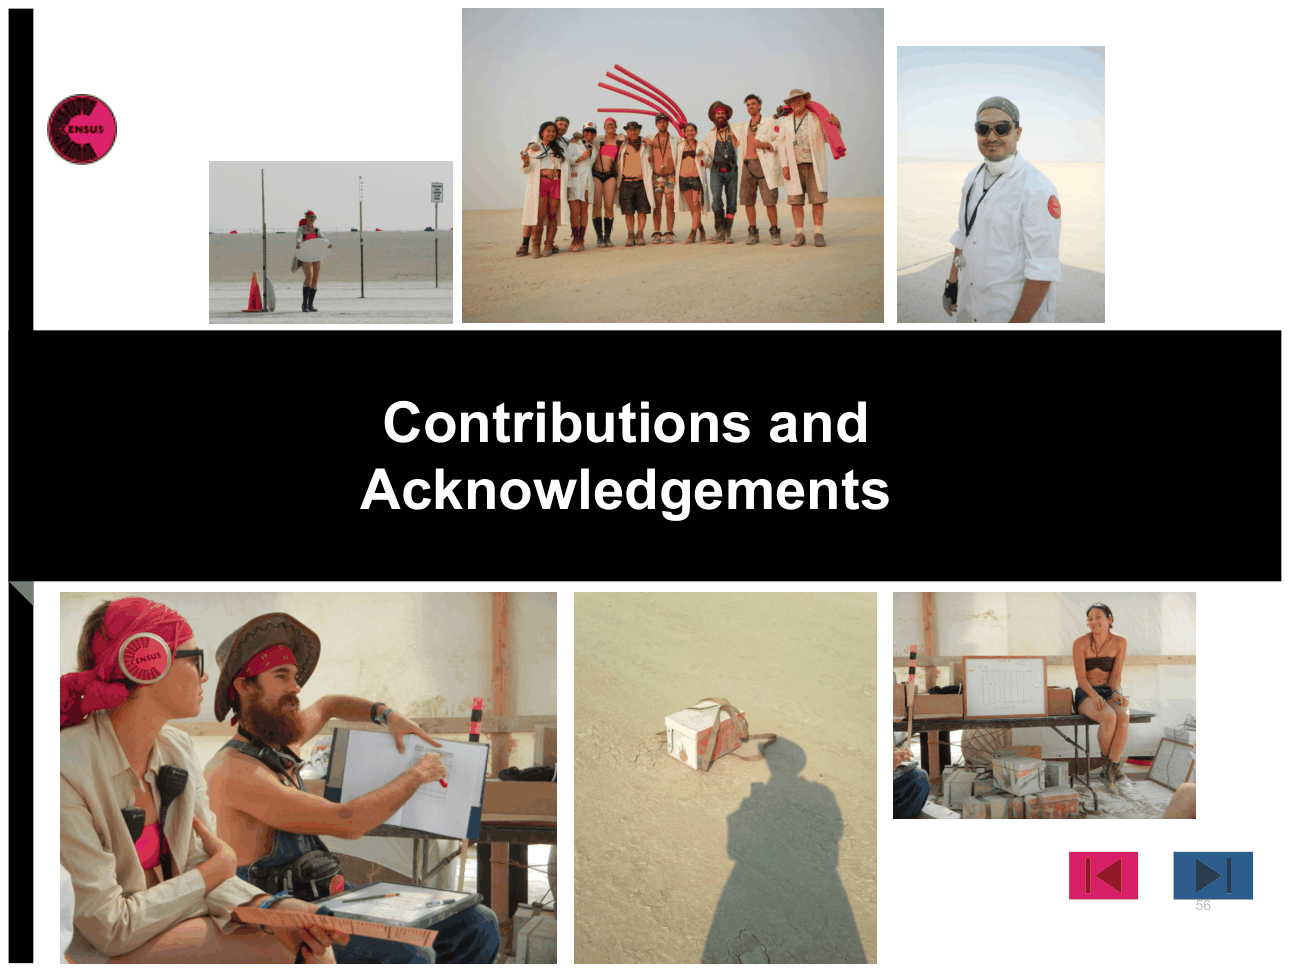
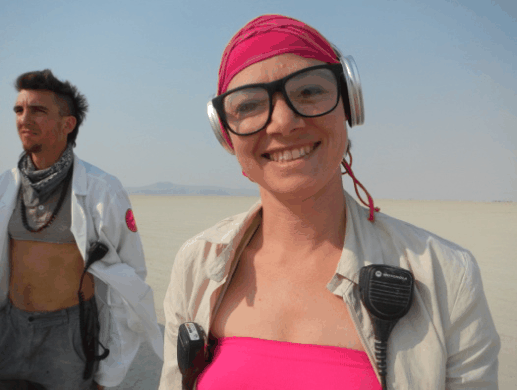
Project coordination: Megan Heller (Countess), Dominic Beaulieu-Prévost (Hunter) and Kateri McRae (Variance) are the principal investigators who led the 2013 Census project.
Photo

Sampling & data analysis:

Dominic Beaulieu-Prévost (Hunter)

Report coordination, layout & design: David Nelson-Gal(Scribble)

Additional Data Visualizations & Analysis:

Steven Crane(Indiana), Andrew Pederson & Alana Glassco (Lovechild)

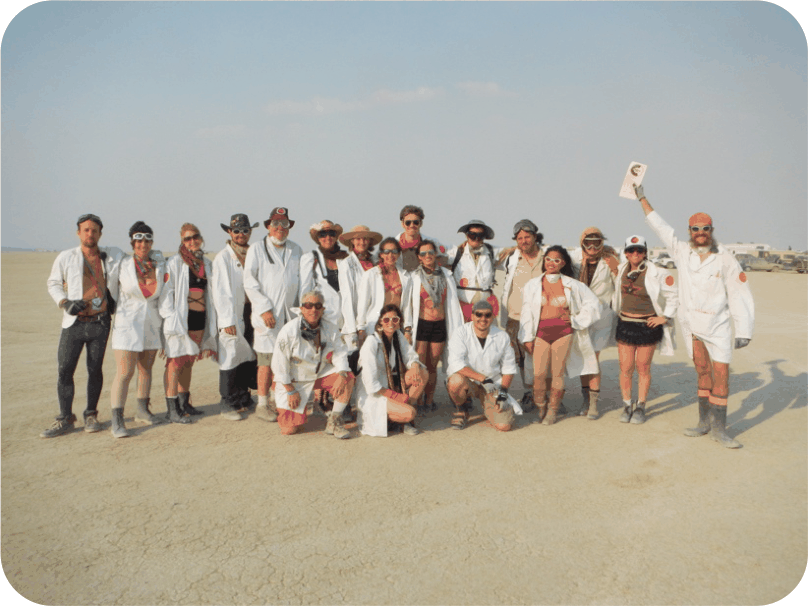
The 2013 Census Lab : The project also involved numerous other volunteers whose contributions were essential in many ways : research collaborators, volunteer coordinators, statisticians, camp builders, gate samplers, keypunchers, census lab hosts, graphic designers, and many more. These contributors will globally be referred to as “the Census Lab”. We would also like to thank the Burning Man organization for the resources that they provided both on playa and off playa and for believing in the project.

A final thanks to all the BRC citizens who contributed to the 2013 Census. The Census project could not exist without you.

Still Curious?

For more information about the 2013 Census project or the people involved in the project, please write to census@burningman.org .

For more information about this report, please write to Dominic Beaulieu-Prévost at beaulieu-prevost.dominic@uqam.ca .

You can also access the Census blog at http://blackrockcitycensus.wordpress.com .
Photo

Citation: Heller, S.M., Beaulieu-Prévost, D., McRae, K, Nelson-Gal, D., and the 2013 Census Lab. (2014). 2013 Black Rock City Census: Weighted results report. Black Rock City Census. Copyright © 2014 Heller et al. This is an open-access report distributed under the terms of Creative Commons Attribution License, which permits unrestricted use, distribution, and reproduction in any medium, provided the original author and source are credited.