2014 Weighted Results
Report Information
What is the Census?
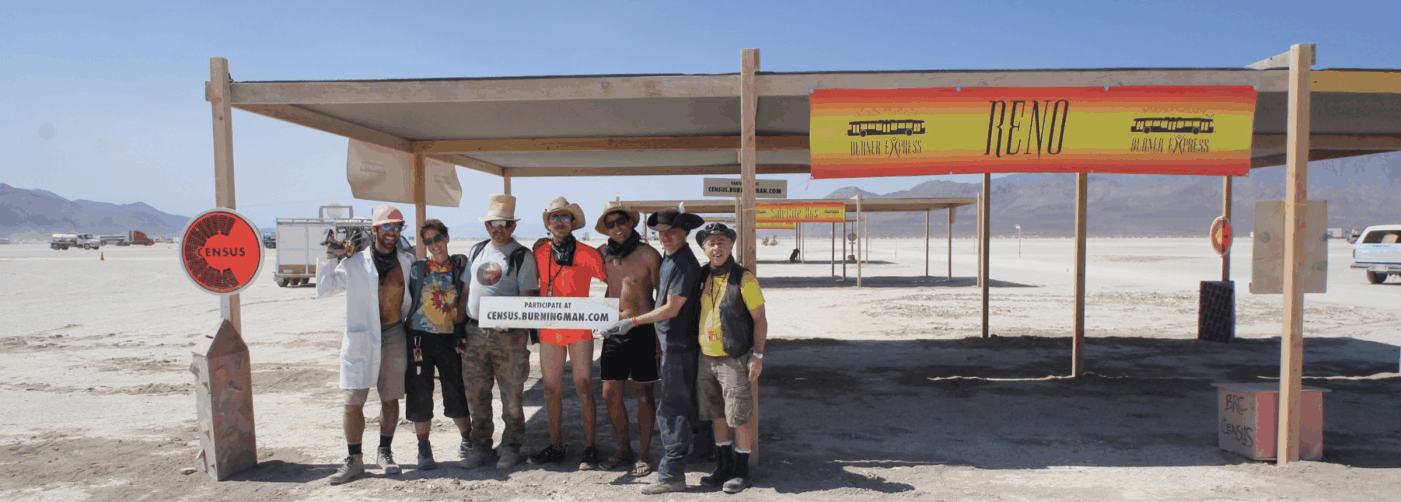
The Census is a collaborative research project that started in 2002.
Although the BRC Census is technically a survey and not a real census (where everyone in a population was sampled), we aspire to be a true census where everyone voluntarily participates. Until that day, we will continue to provide the most complete picture possible of the highly diverse population of Black Rock City.
Method
- Based on analysis of 11707 surveys filled out online after the event in 2014 (roughly 1 in 5.5 citizens!)
- This is roughly the same proportion of useful data as the 2012 and 2013 surveys
- This is the 3rd consecutive year in BRC history that these results were weighted to correct for non-response biases.
- Implication: these results are the most reliable estimates available concerning the BRC population
- Project was approved by a research ethics committee (@ Denver University) and confidentiality of respondents is protected
Details about the weighting procedure
- As with 2012 & 2013, the 2014 BRC Census created an “unbiased” reference by randomly sampling cars at the gate during ingress, asking nine sociodemographic questions of each sampled burner who accepted.
- In addition, we surveyed entering Burner Express Riders to add their data to the weighting procedure.
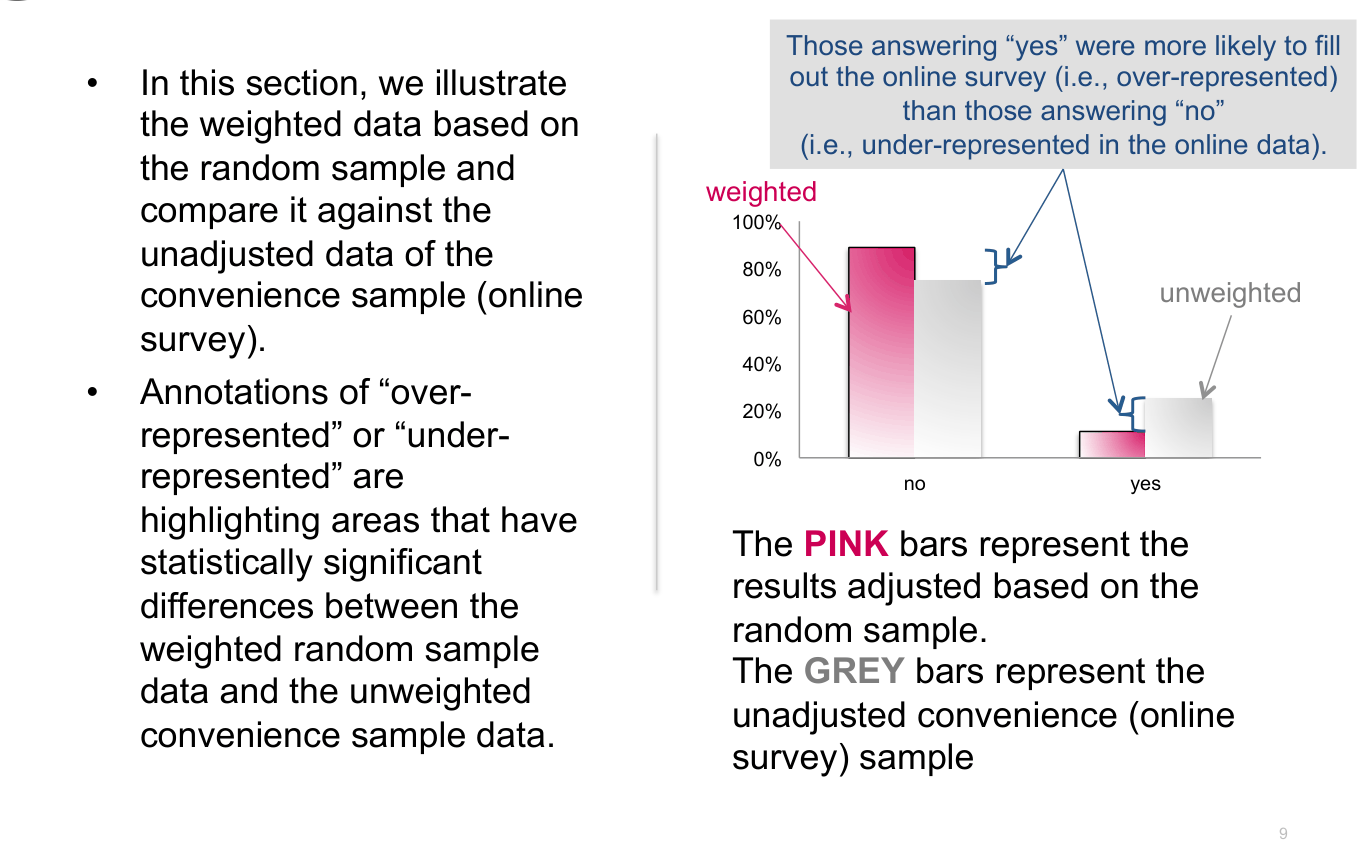
- The weighting procedure corrects the biases in the after-event, online survey due to self-selection. (i.e., burners who decided to fill out the Census might be different from those who chose not to fill it out)
- In population surveys, the national census is used as a reference to weight (i.e., adjust) each survey.
- Thus, the results from 2014 Census were weighted according to this random sampling at Gate and Burner Express, improving the collective accuracy of the data.
2014 Census Results
- This presentation covers the descriptive results for the most important questions.
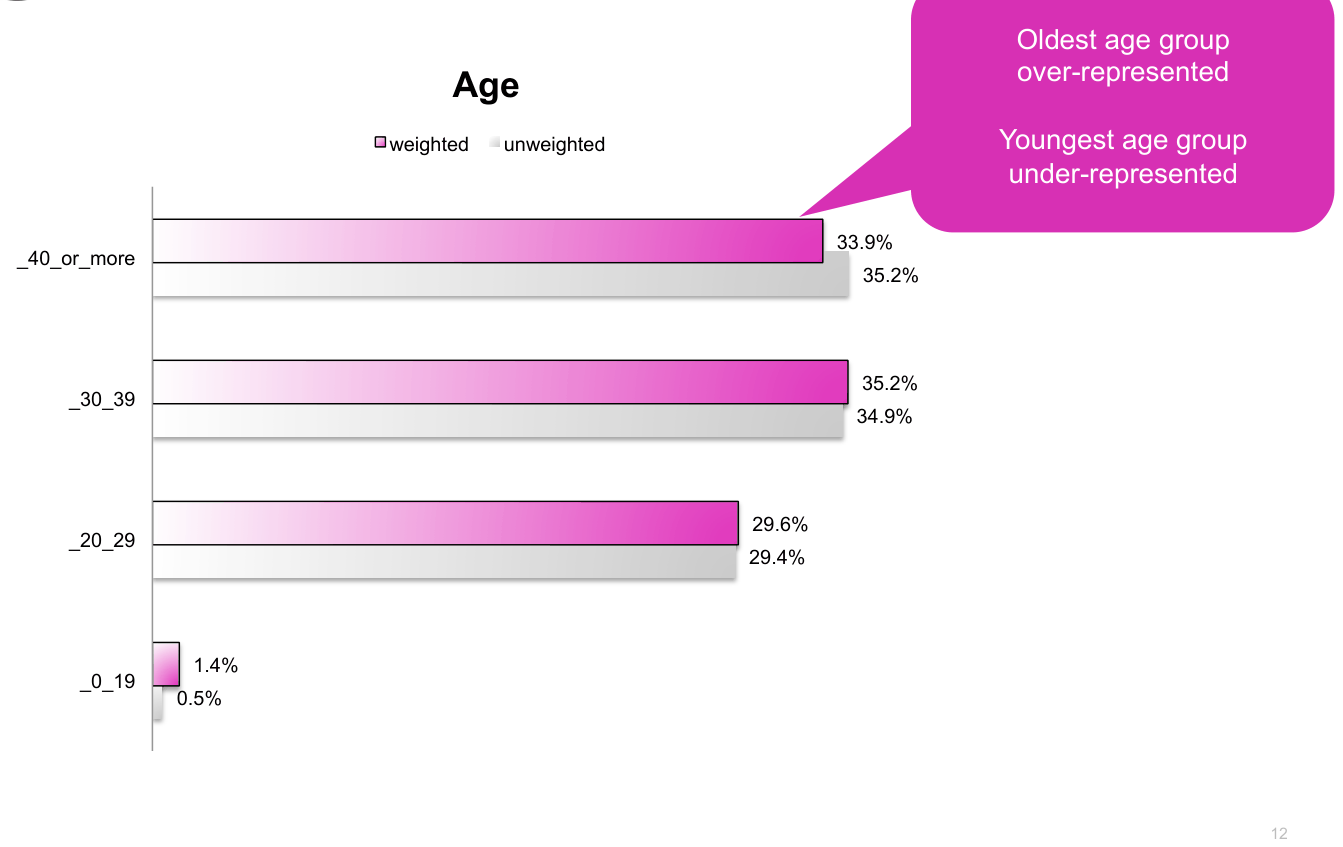
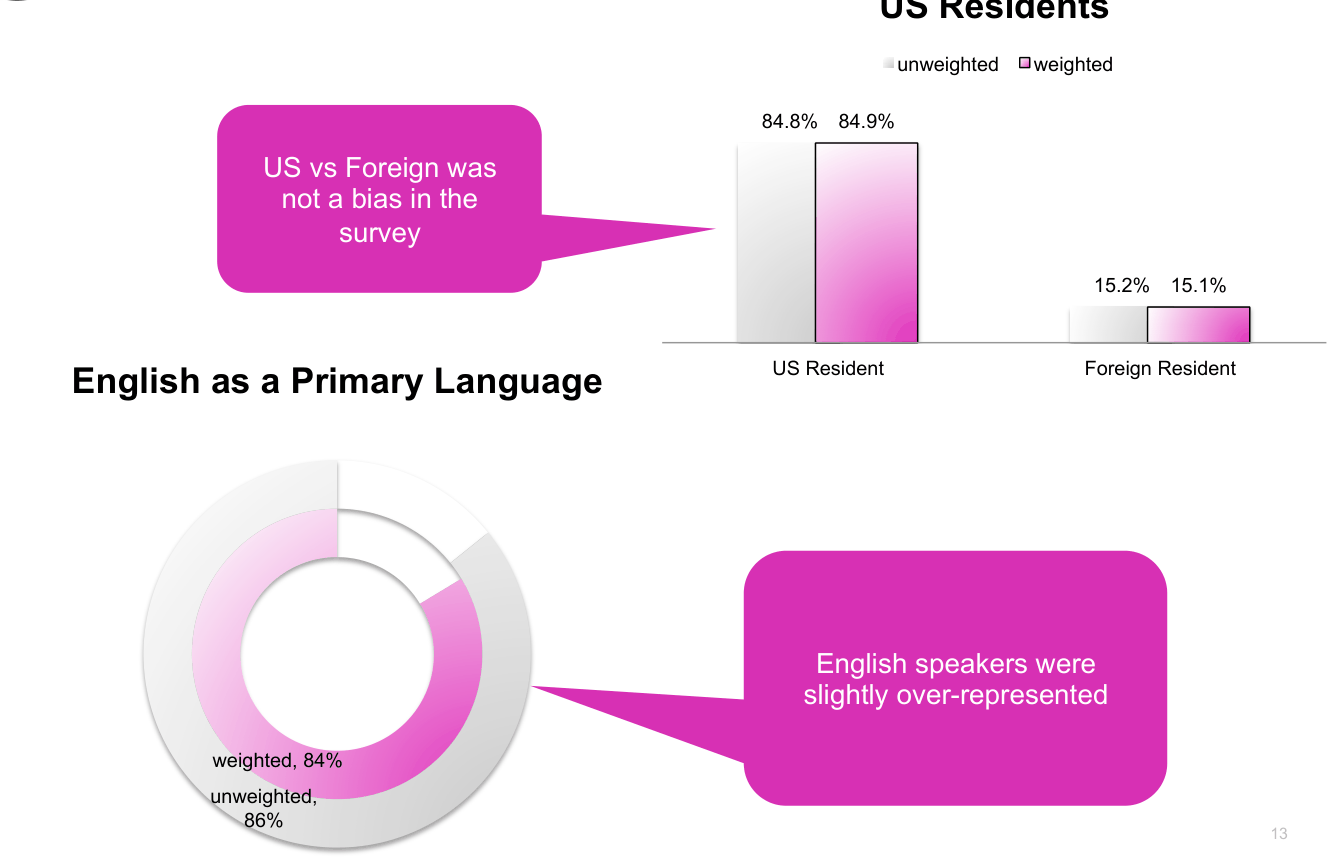
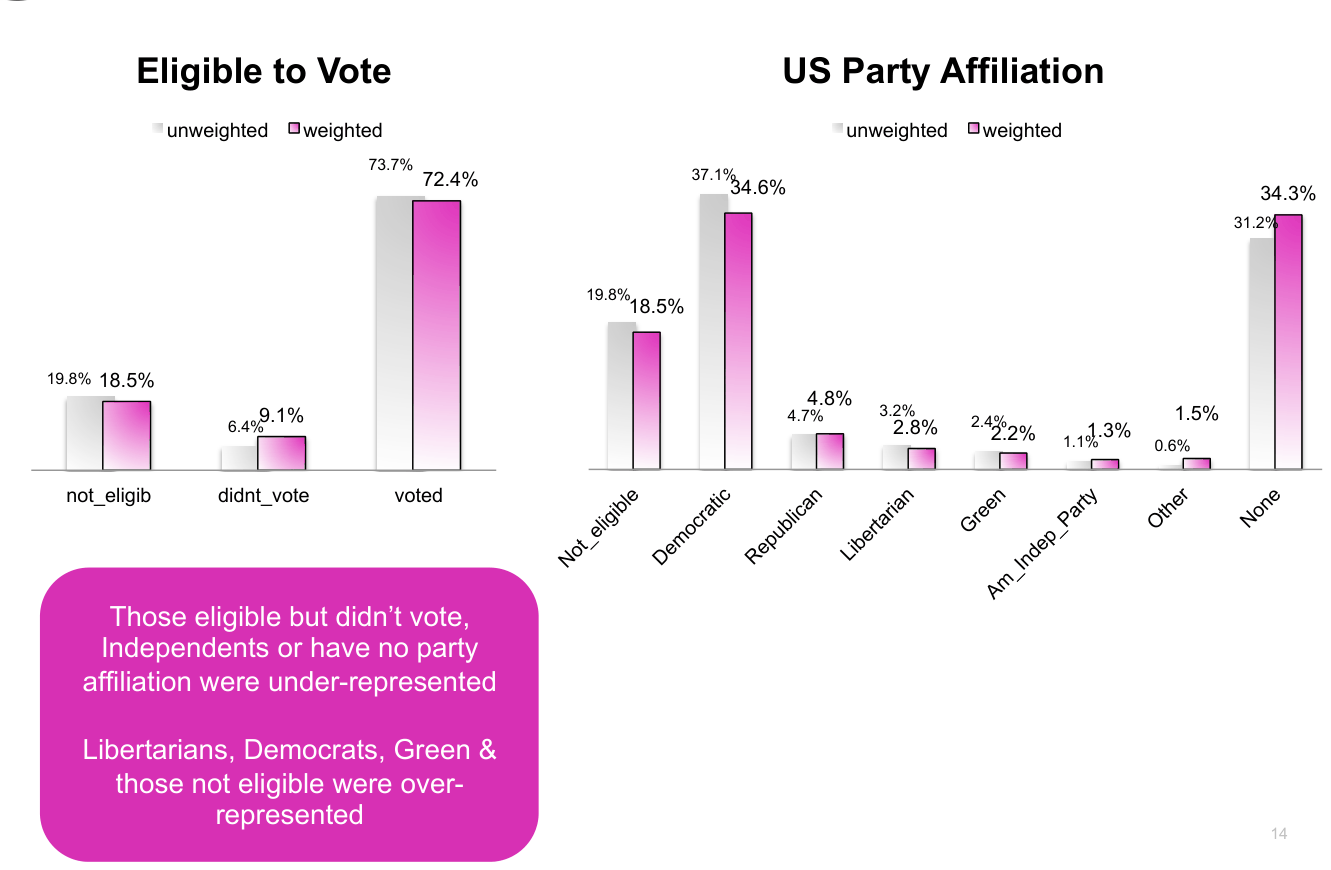
- The first section of results contrasts the weighted (i.e., corrected results) and the unweighted (i.e., original but biased) results to help understand the usefulness of the procedure.
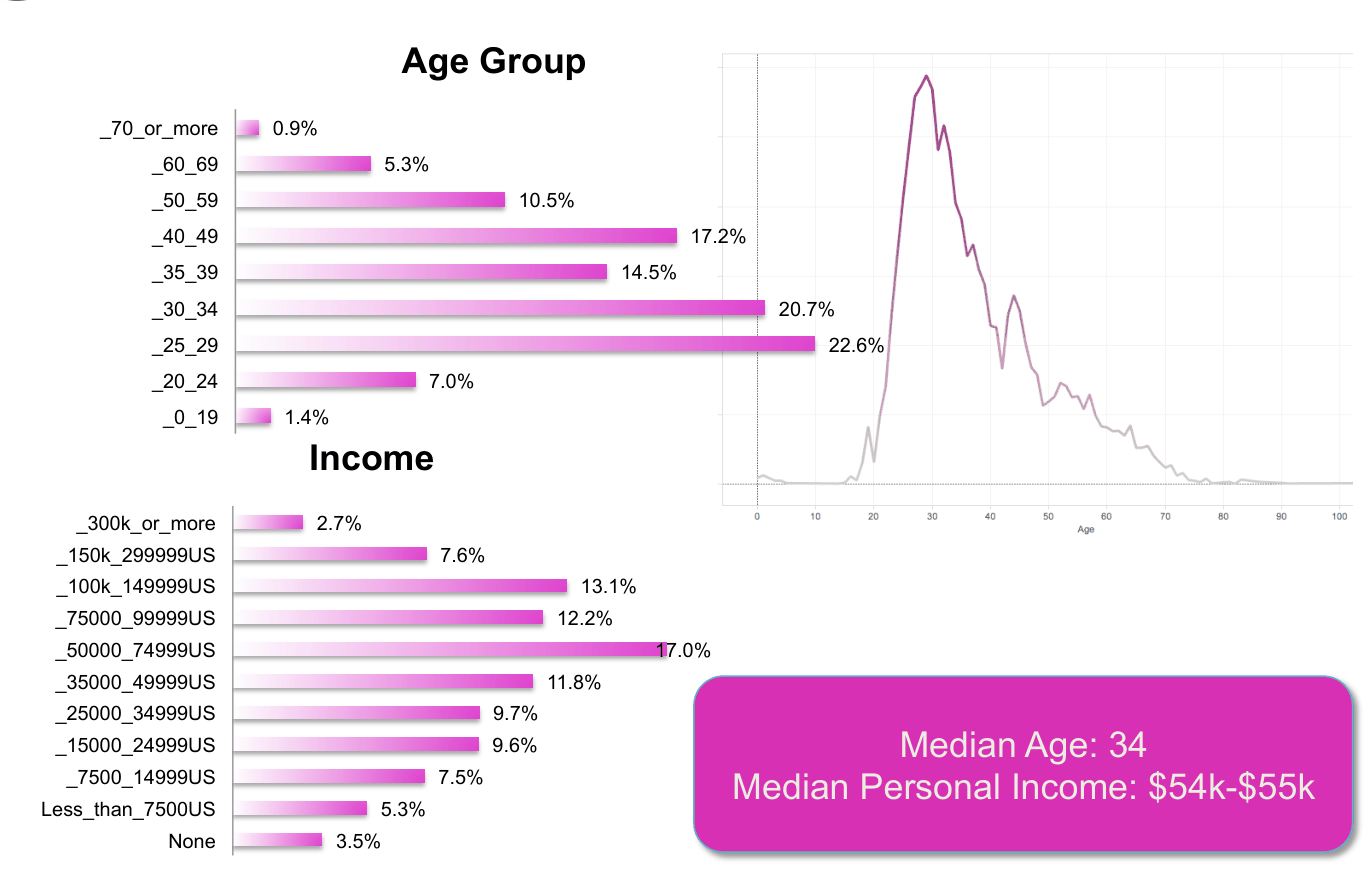
- The remaining sections present only the weighted results.
- These results are the most reliable estimates that we have of the Black Rock City population.
- The “real” population values could be slightly different from the presented values due to measurement error.
- For more results, visit us on the playa (near Center Camp) and follow the Census Lab’s blog at
Weighting the Census
Variables used to weight the 2014 Census
- Inherent self-selection bias in past surveys
- 2014 complemented census with a random sampling at the gate
- Random sample allowed us to weight the collected data
- Variables used to weight the 2014 Census:
- Day of arrival versus number of participants arriving
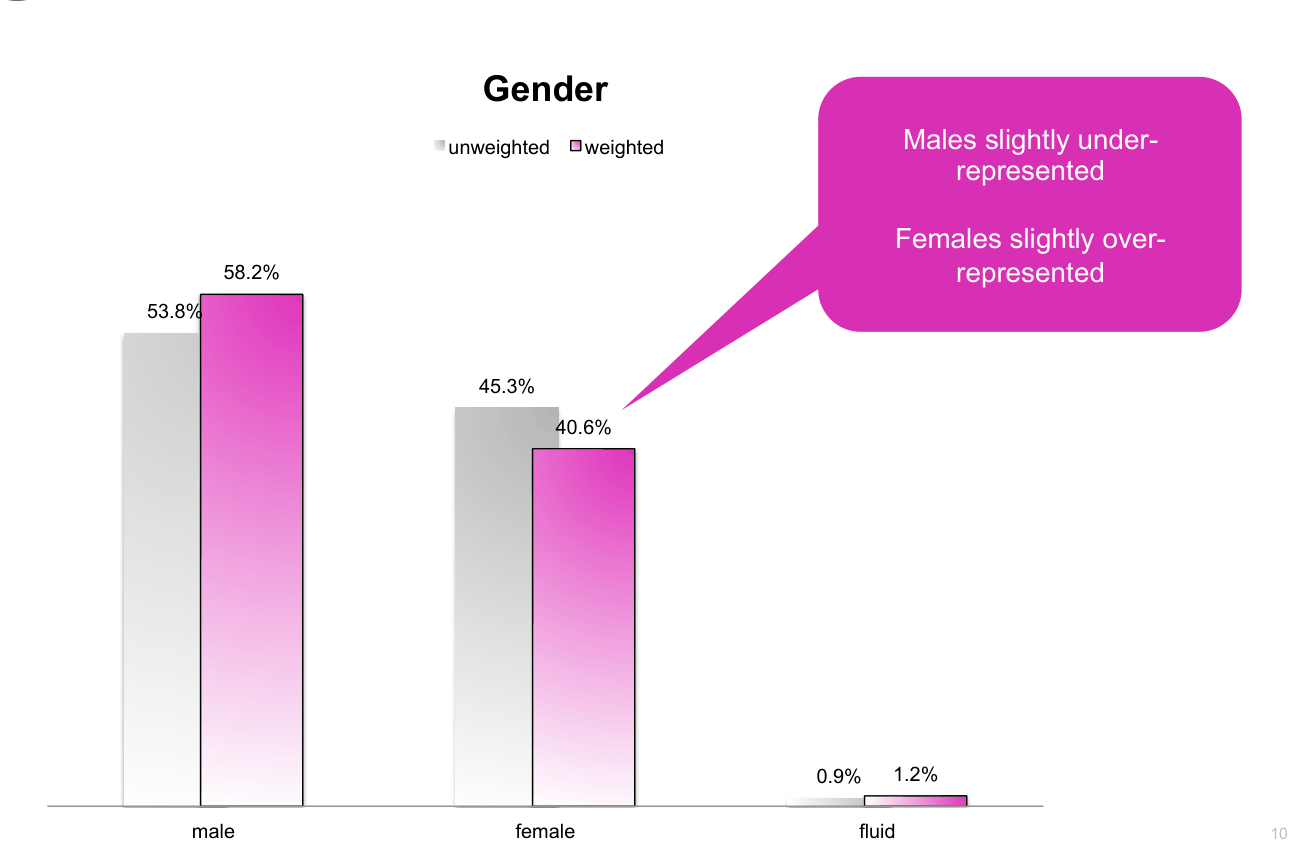
- Gender
- Age
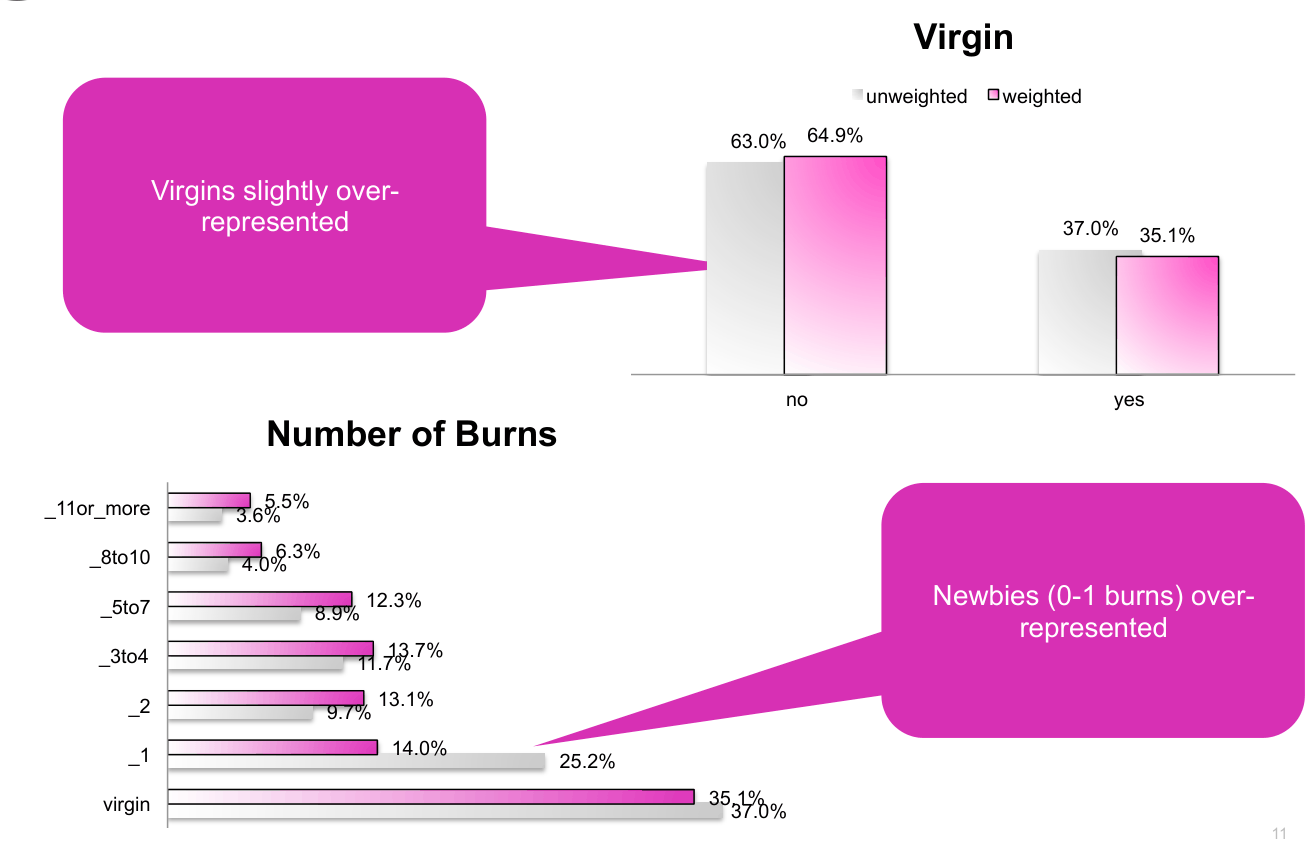
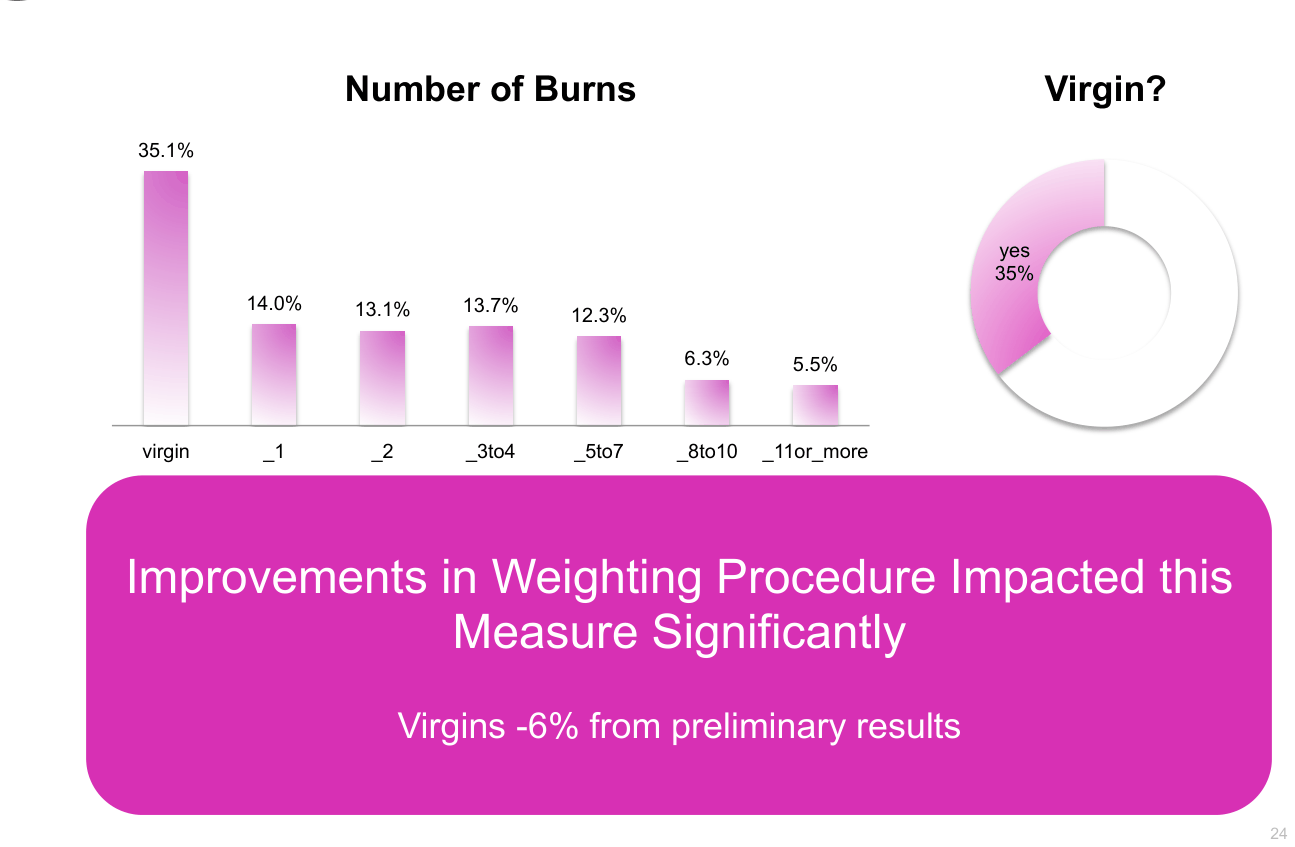
- Virgin Burner or not
- Foreigner or not
- English Speaker as a first language or not
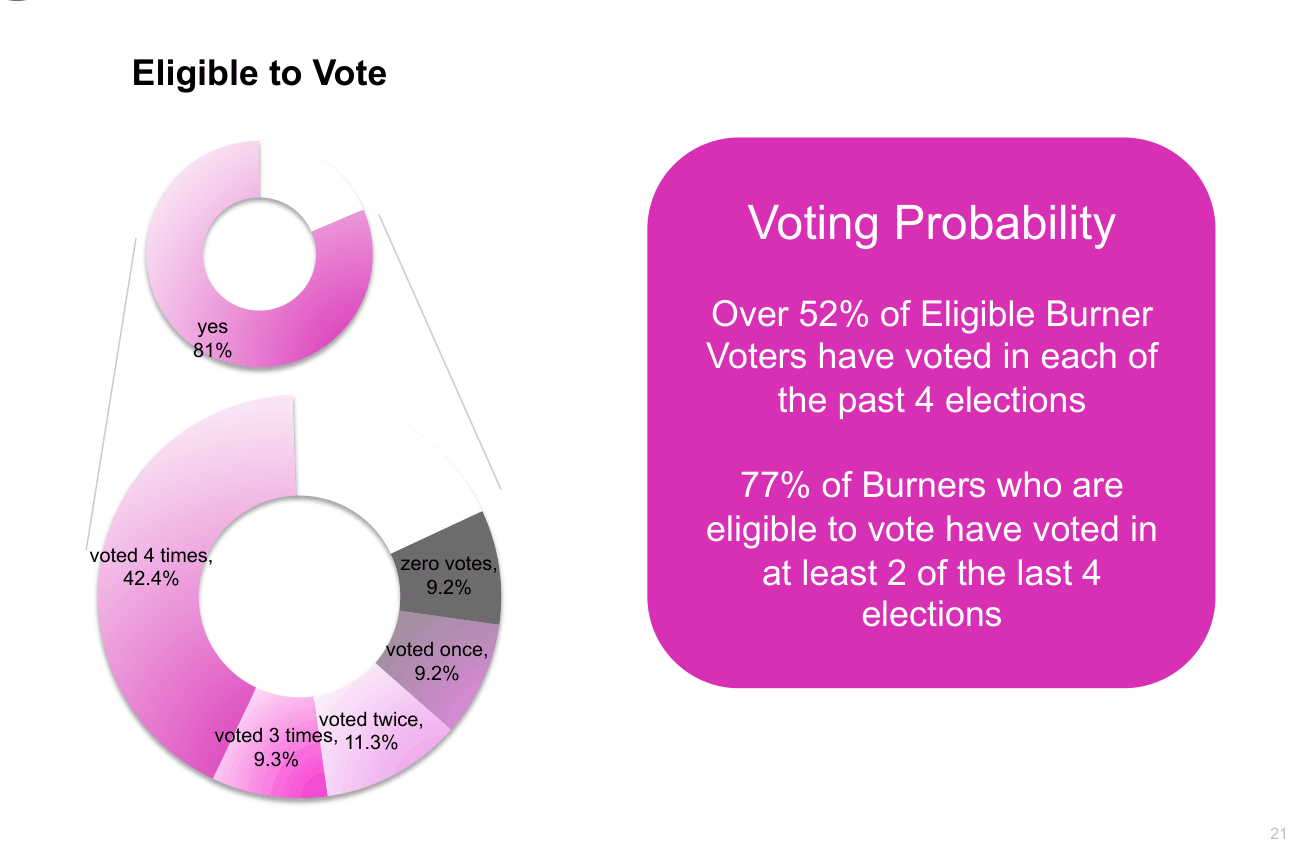
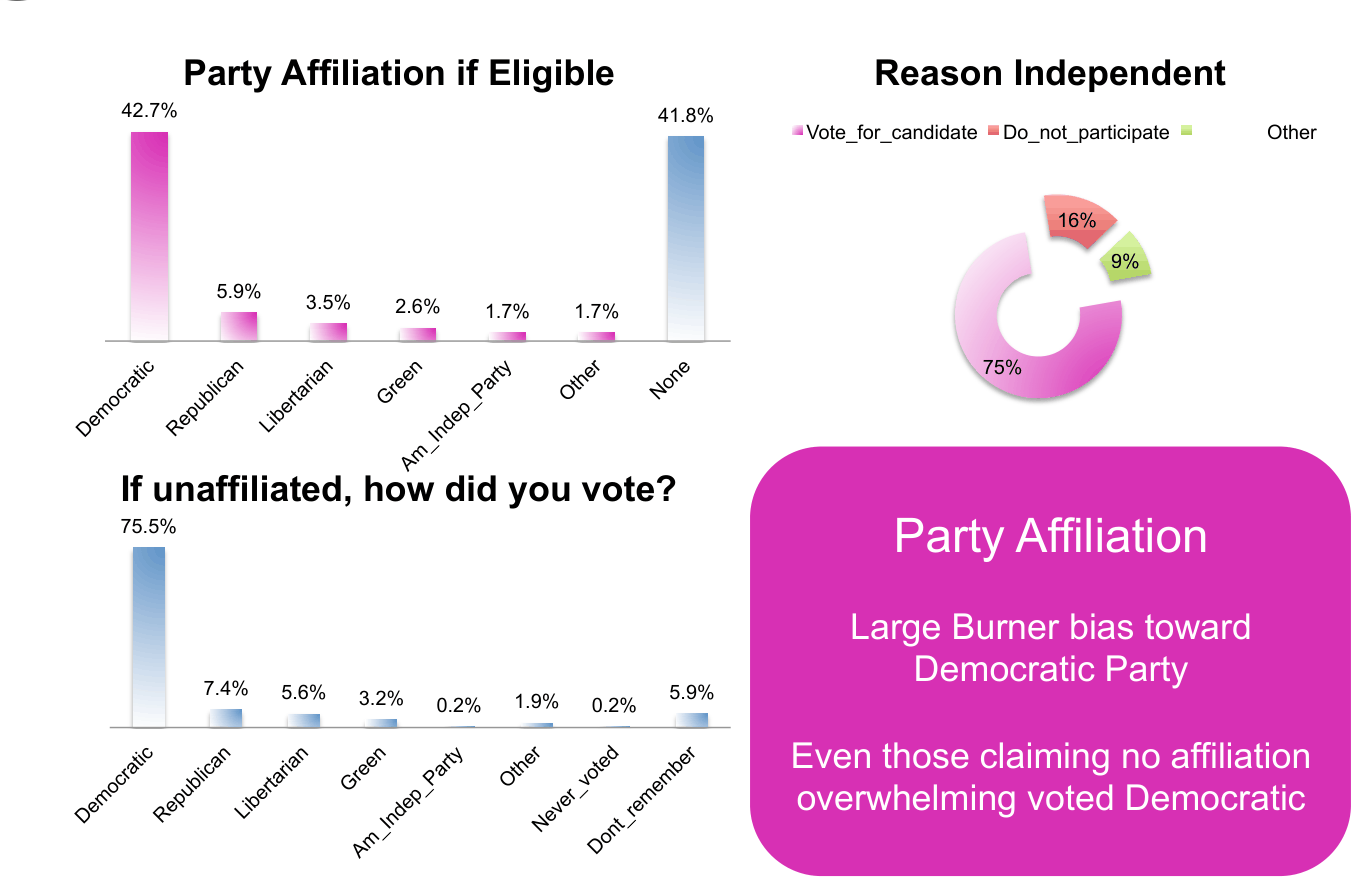
- US Party Affiliation (if eligible to vote in the US)
- Voting Behavior
Details about the weighting procedure
- As with 2012 & 2013, the 2014 BRC Census created an “unbiased” reference by randomly sampling cars at the gate during ingress, asking nine sociodemographic questions of each sampled burner who accepted.
- In addition, we surveyed entering Burner Express Riders to add their data to the weighting procedure.
- The weighting procedure corrects the biases in the after-event, online survey due to self-selection. (i.e., burners who decided to fill out the Census might be different from those who chose not to fill it out)
- In population surveys, the national census is used as a reference to weight (i.e., adjust) each survey.
- Thus, the results from 2014 Census were weighted according to this random sampling at Gate and Burner Express, improving the collective accuracy of the data.
Understanding this section
Weighting Variables
Sociodemographic Characteristics
Sociodemographic Characteristics
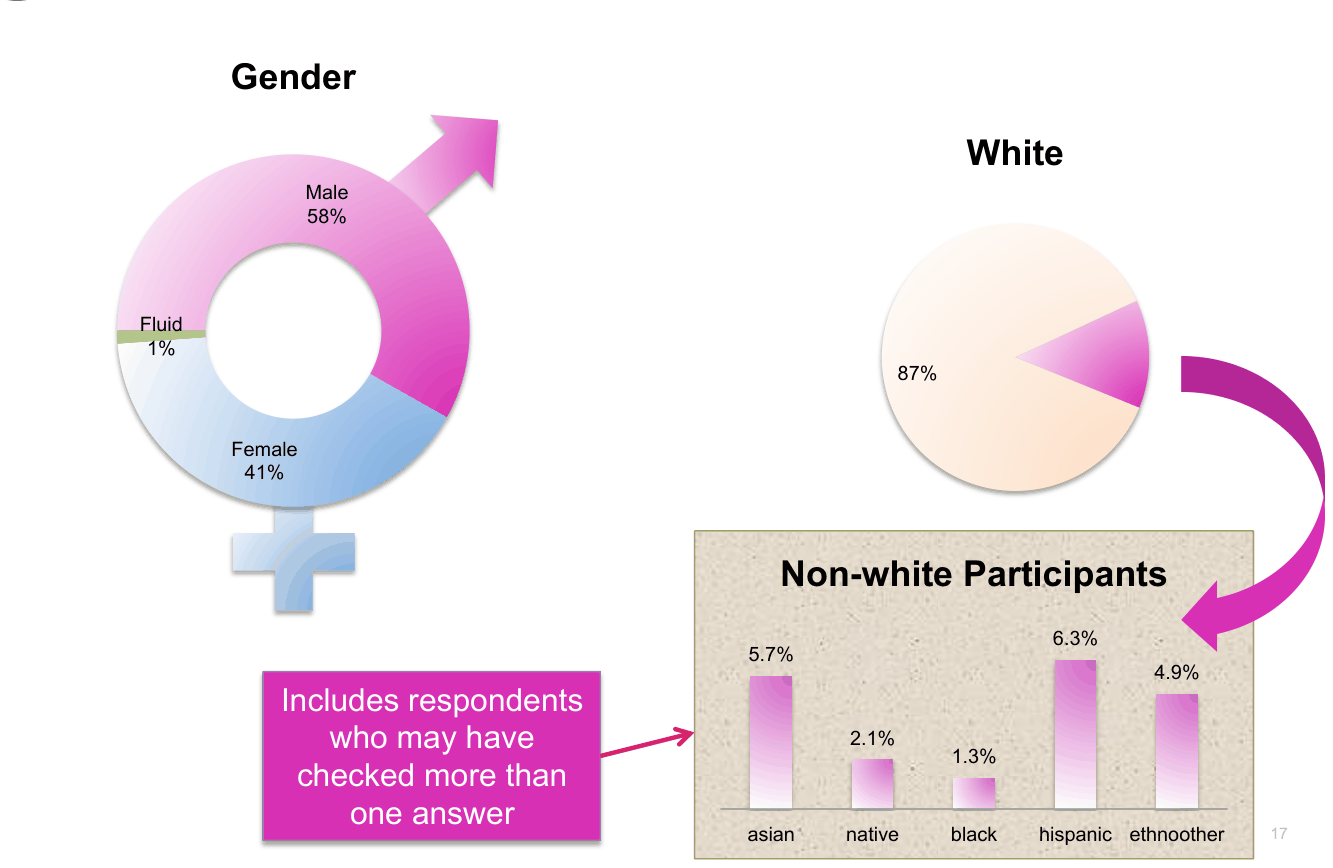
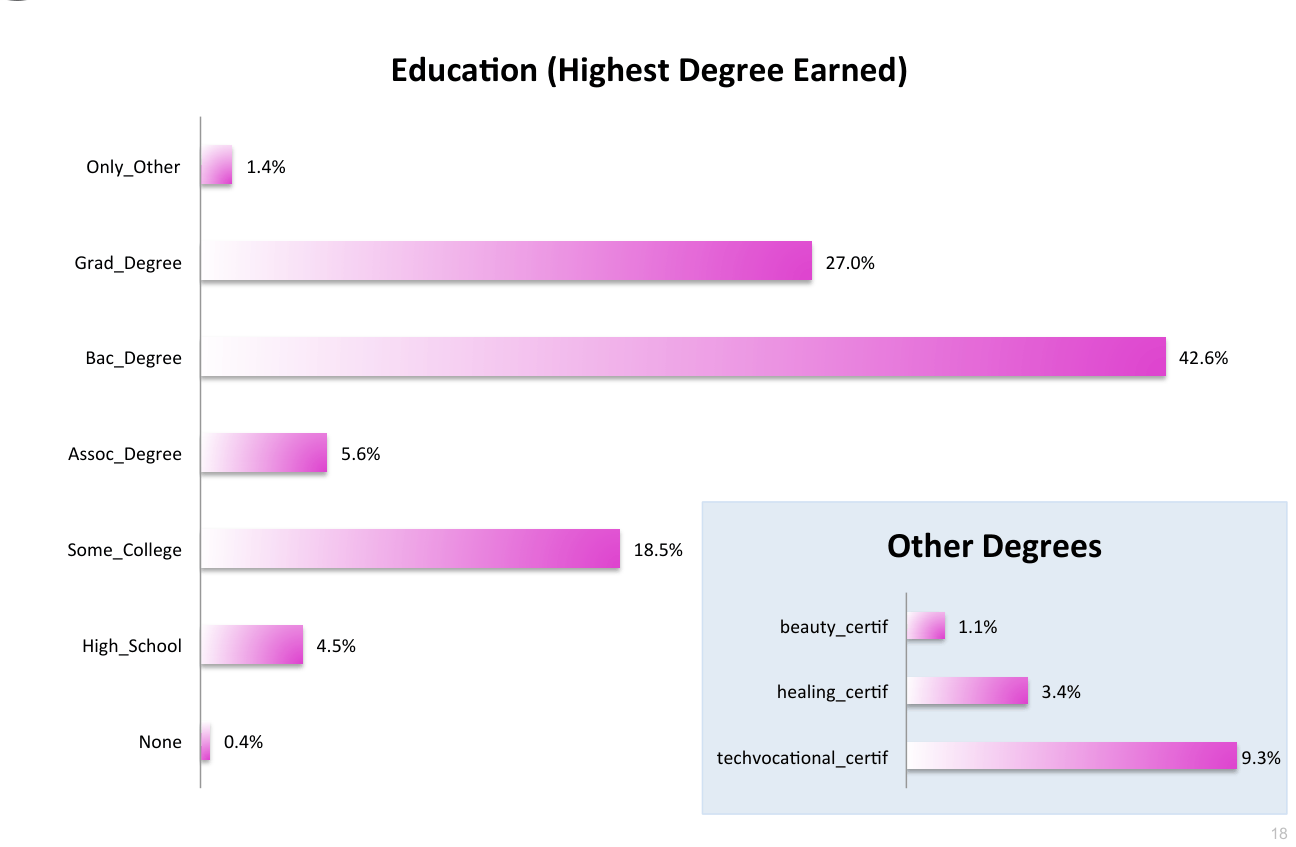
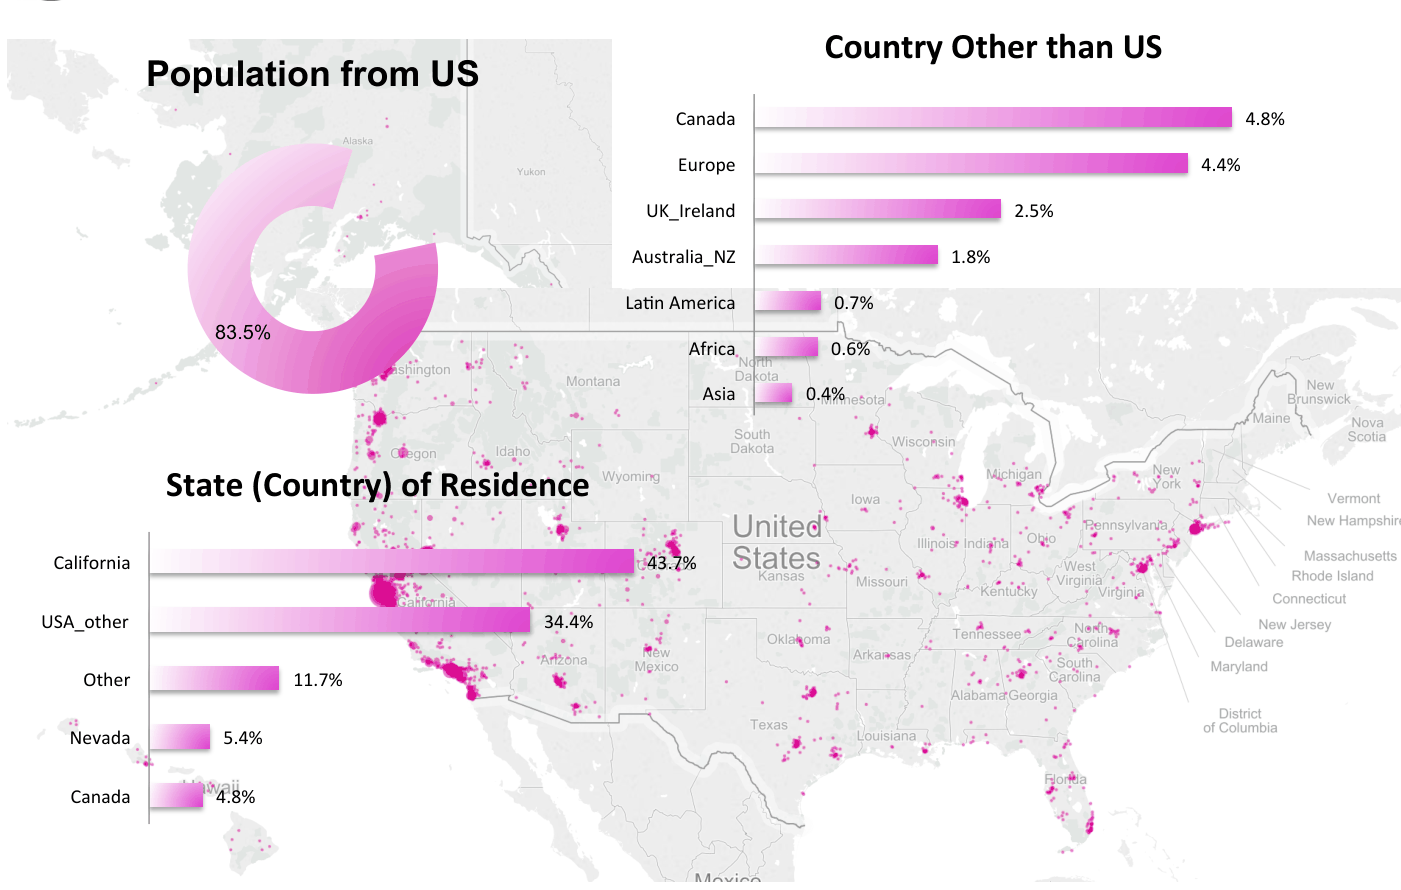
Sociodemographic Characteristics (USA)
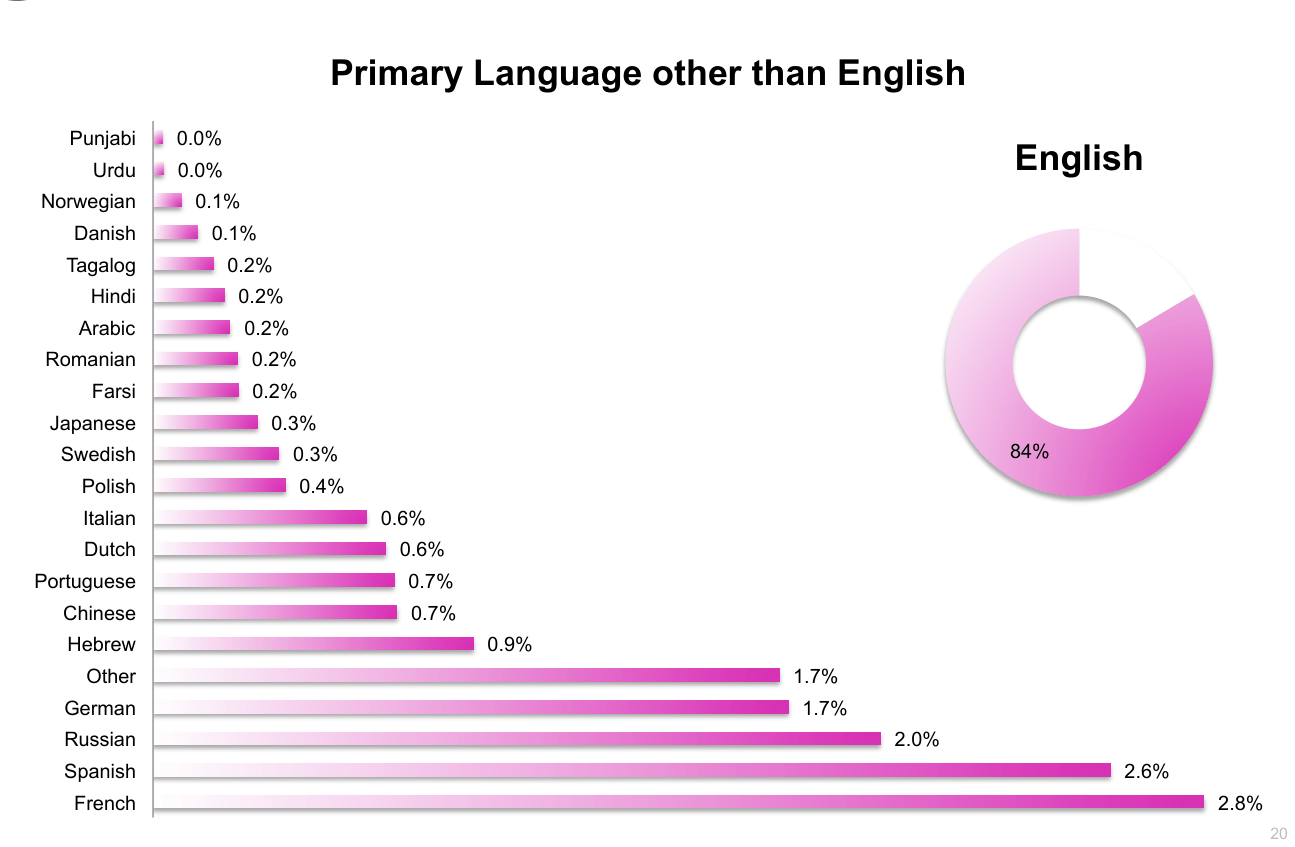
Sociodemographic Characteristics
Burning Man Related Variables
Burning Man Related Variables
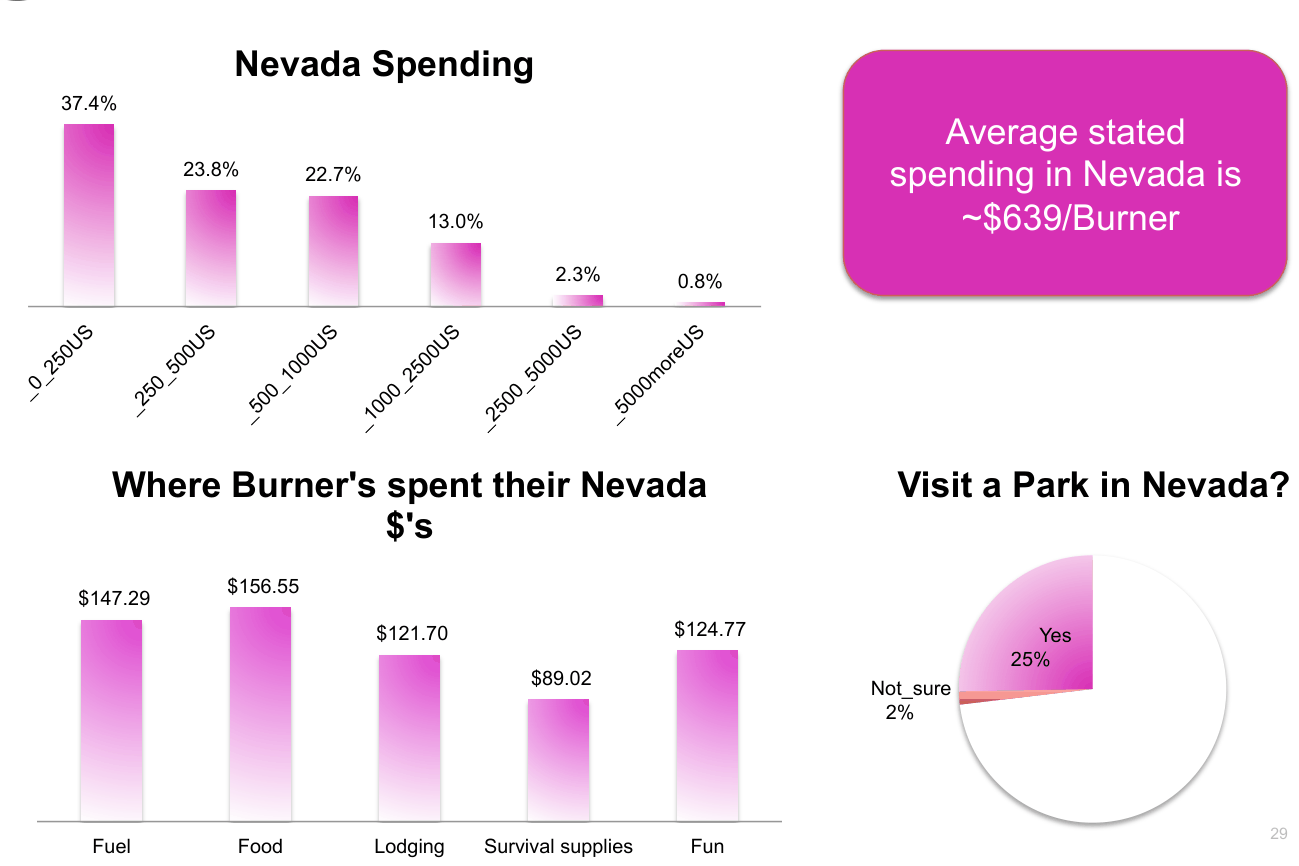
Impact on Nevada
Burning Man Related Variables
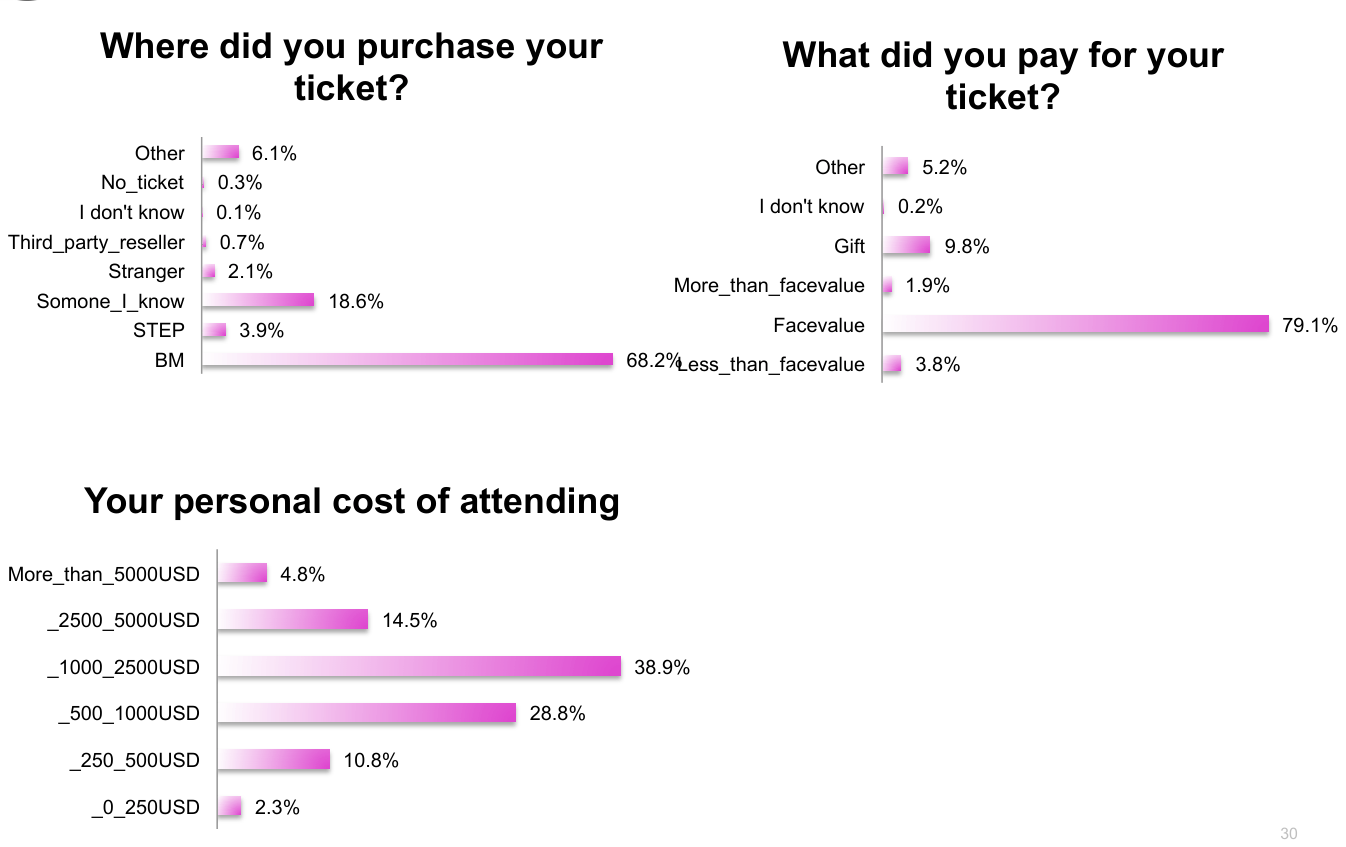
Life at Burning Man
Camping
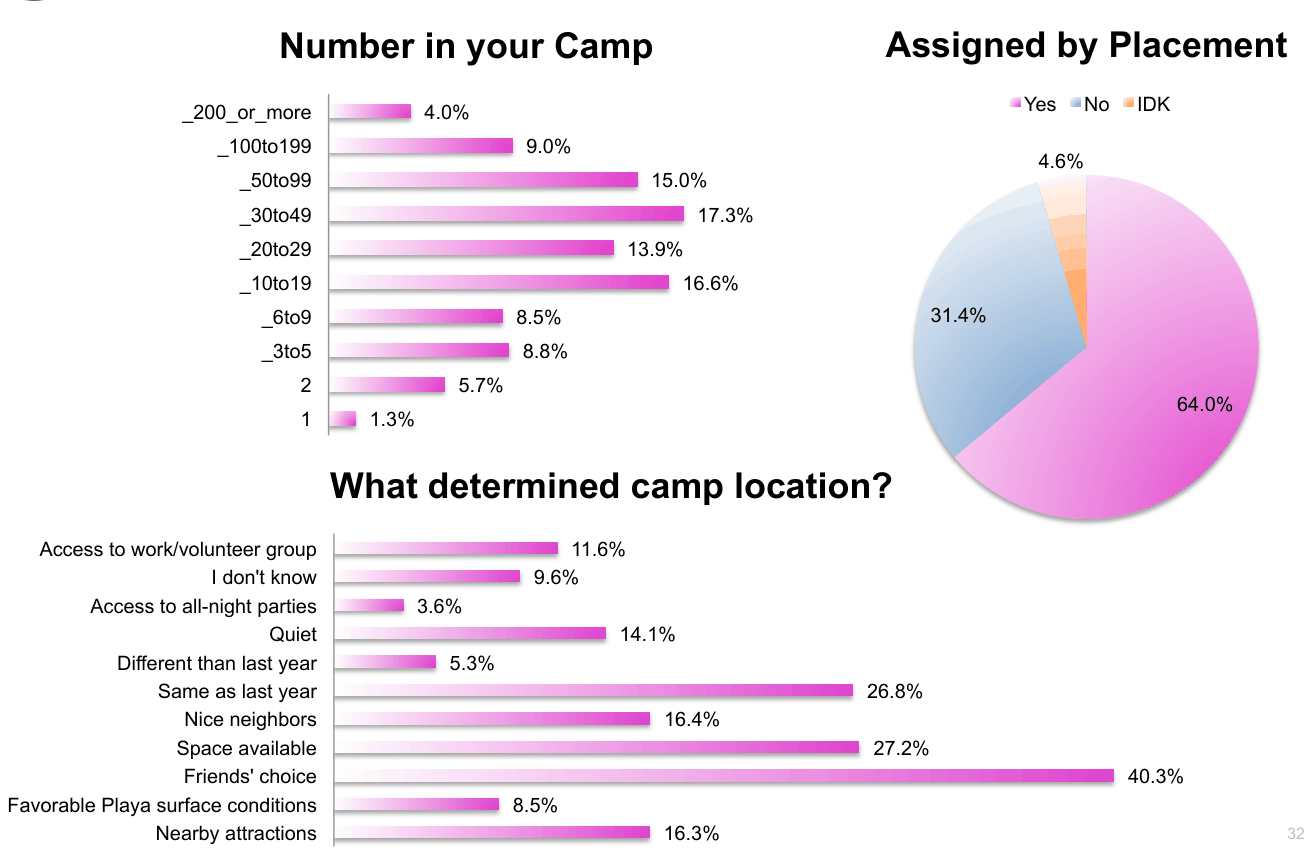
Burning Man Specific Variables
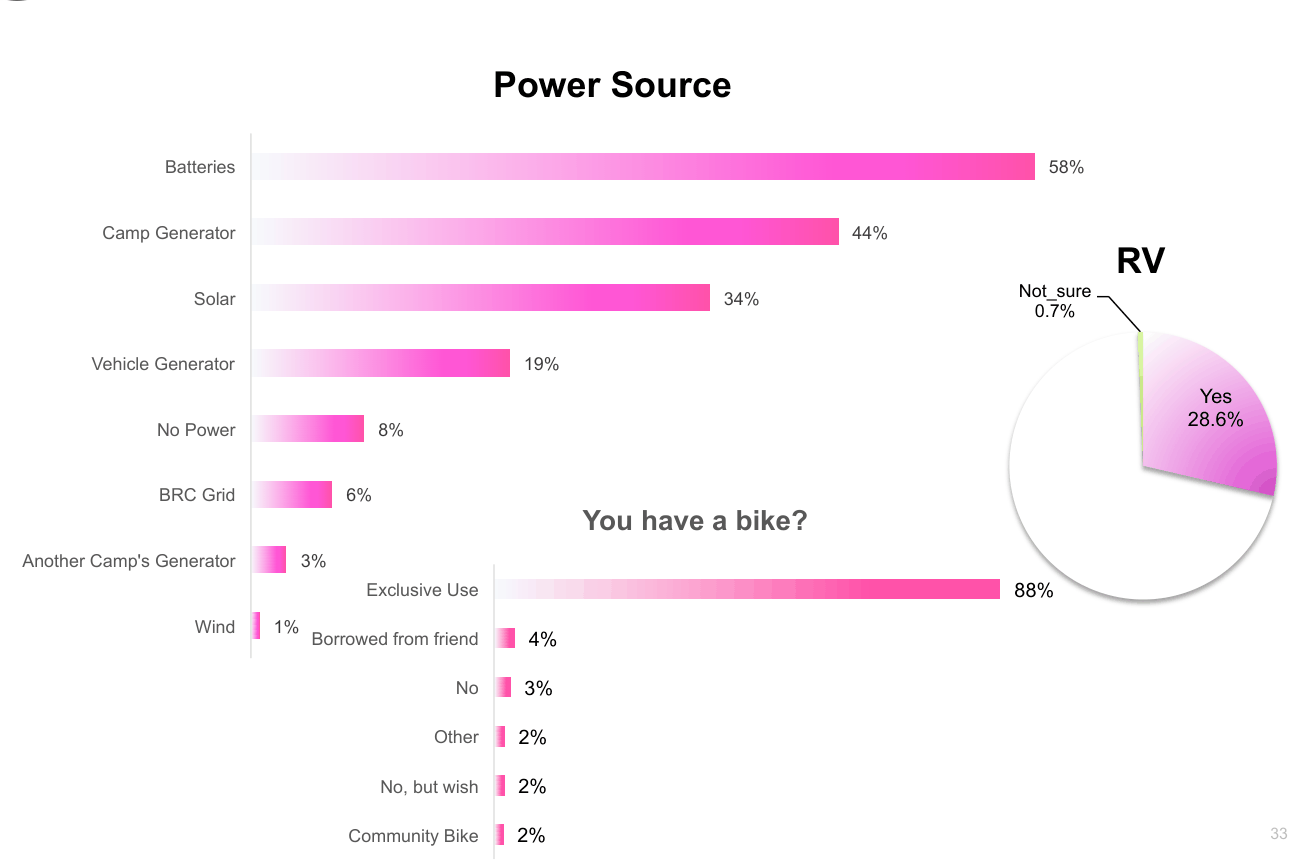
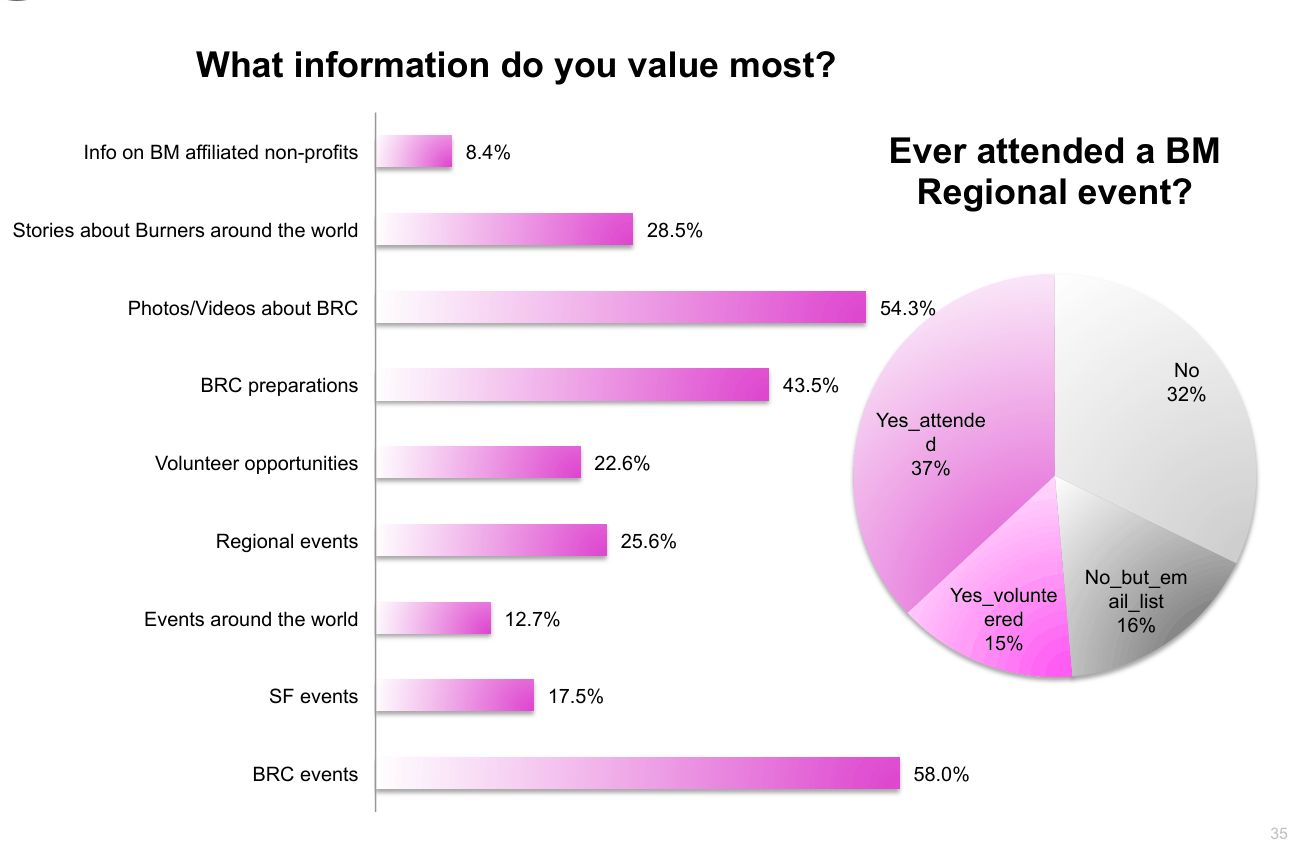
Burning Man Related Variables - Information
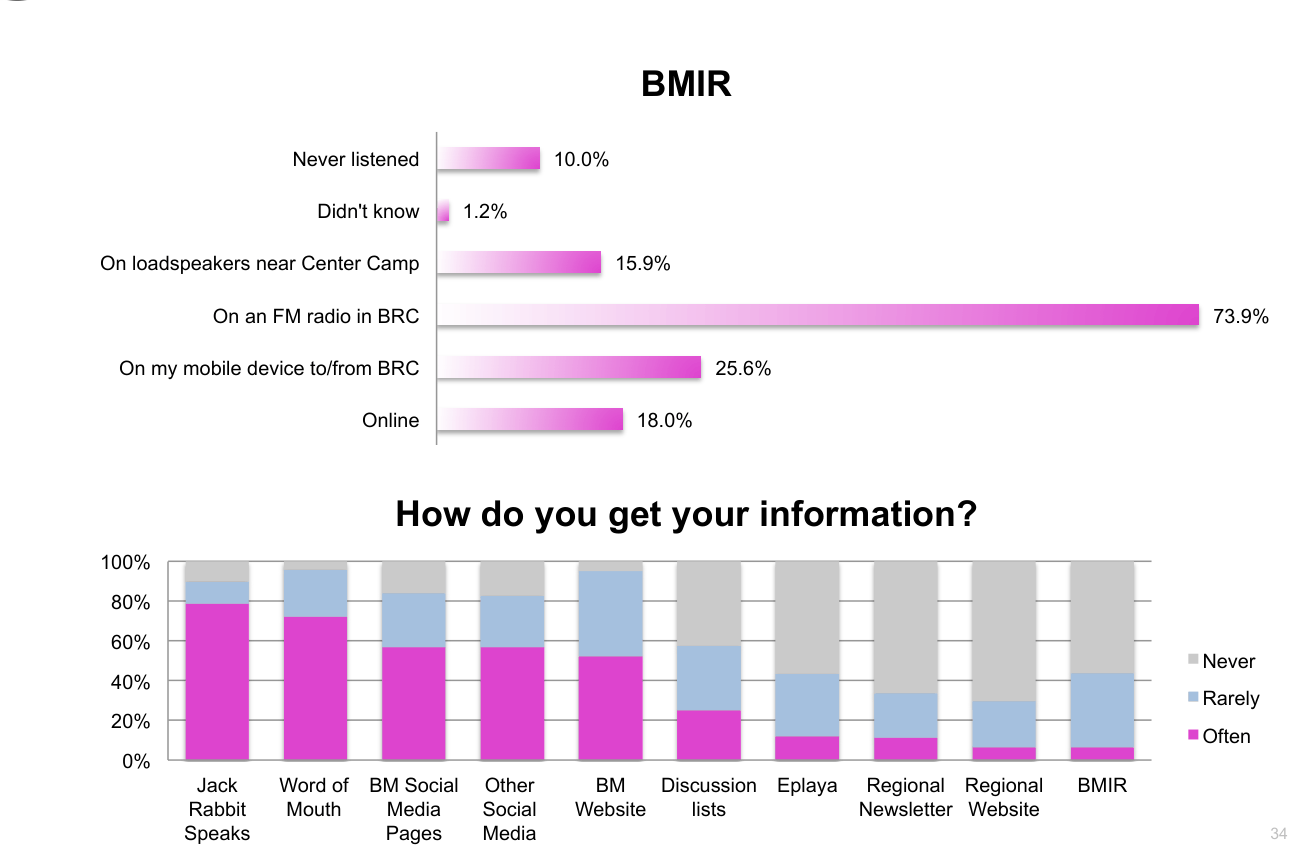
Burning Man Related Variables
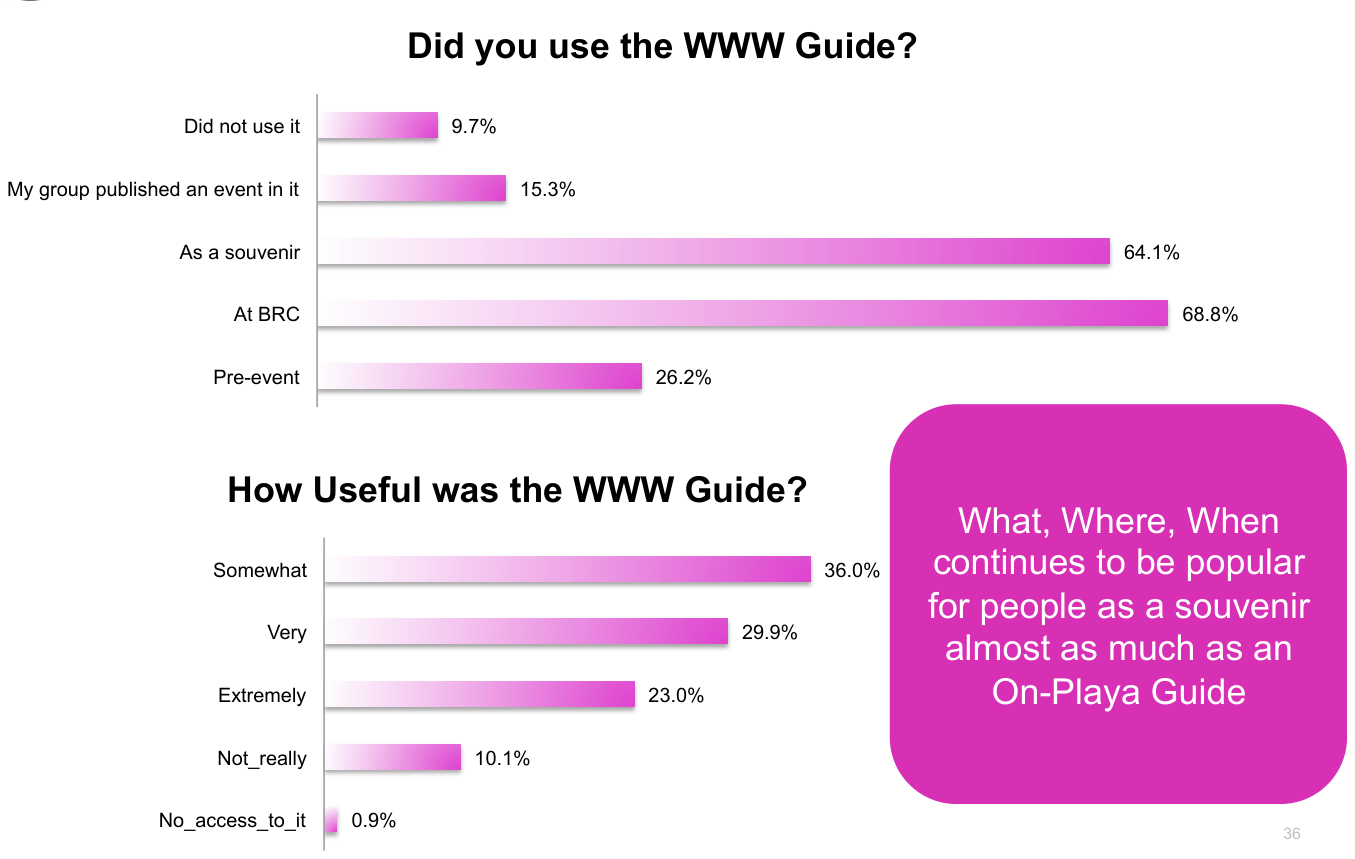
Burning Man Specific Variables – WWW
Identity & Self
Sexual Orientation and Attraction
Sexual Orientation
In regard to sexual attraction,
0.3%
4.2%
reported heteronormativity
10.3%
persists within the Burning Man
8.7%
population. This ideology is
7.0%
reflective of distributions in the
69.4%
default world with men reporting less fluidity in sexual attraction than females.
Heterosexual
Gay_Lesbian Bisexual
Bicurious
Asexual
Refuse_labels
100%
90%
80%
70%
60%
50%
40%
30%
20%
10%
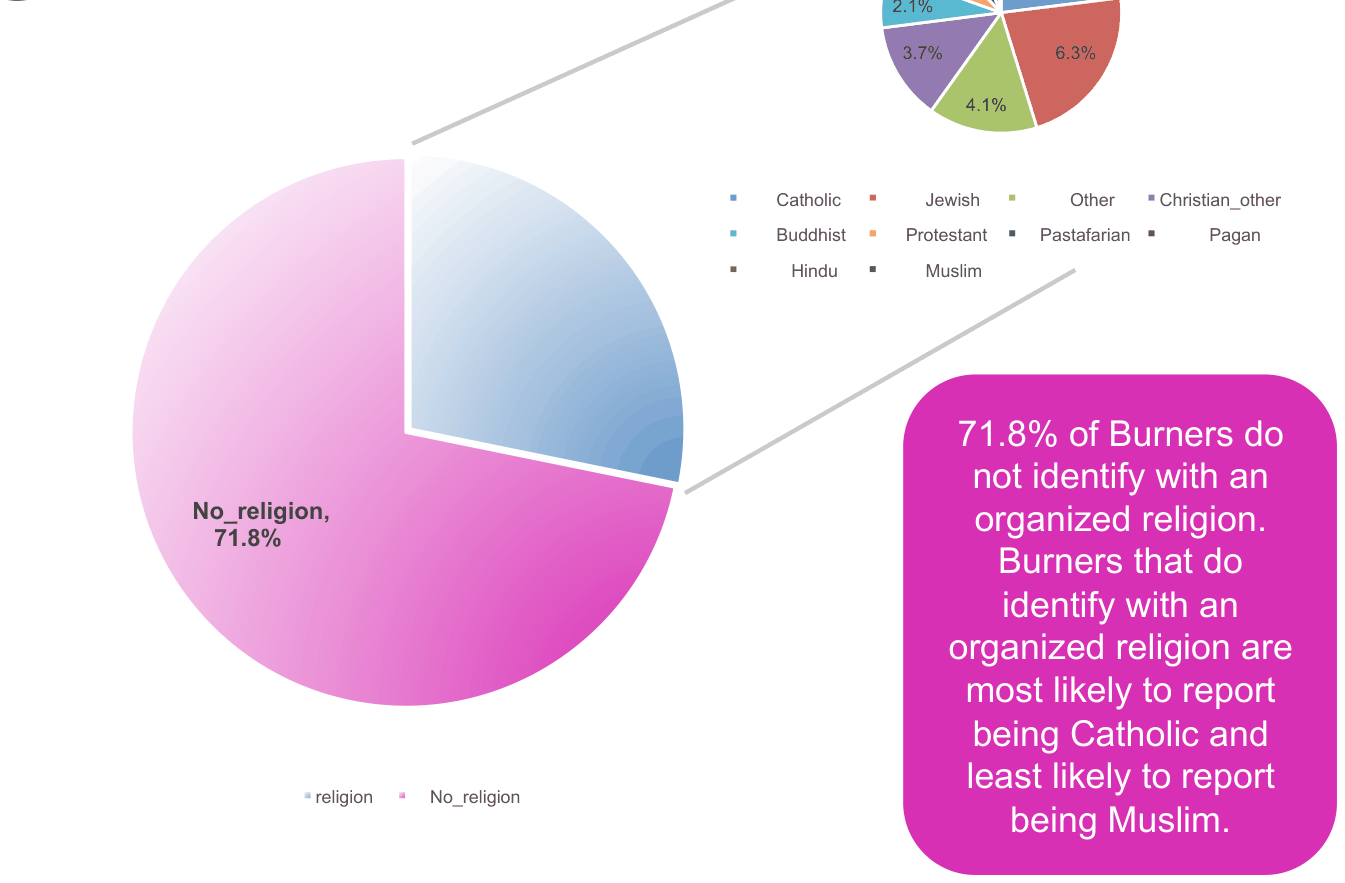
Religion
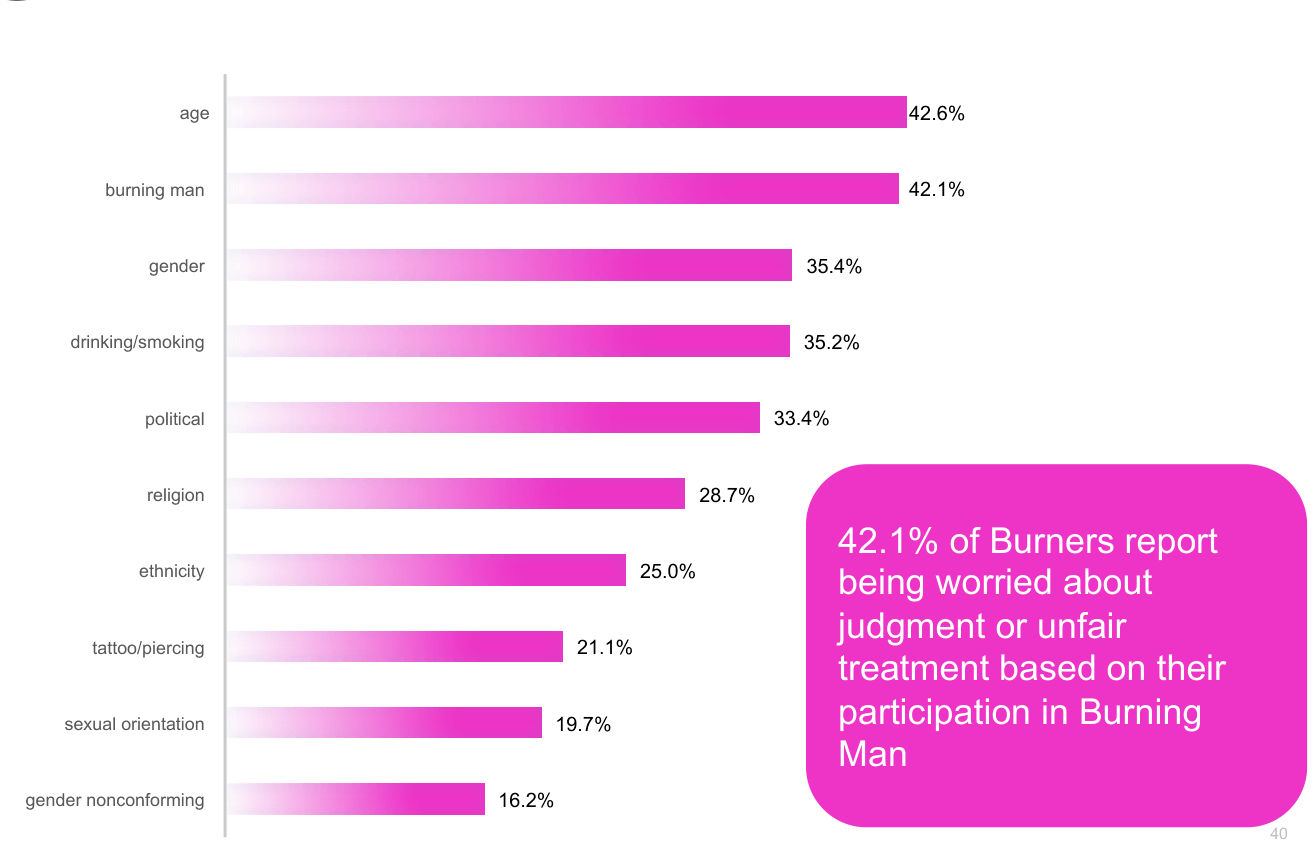
Report of Judgment and Unfair Treatment
Main Reasons to Go to Burning Man
Contributions and Acknowledgements
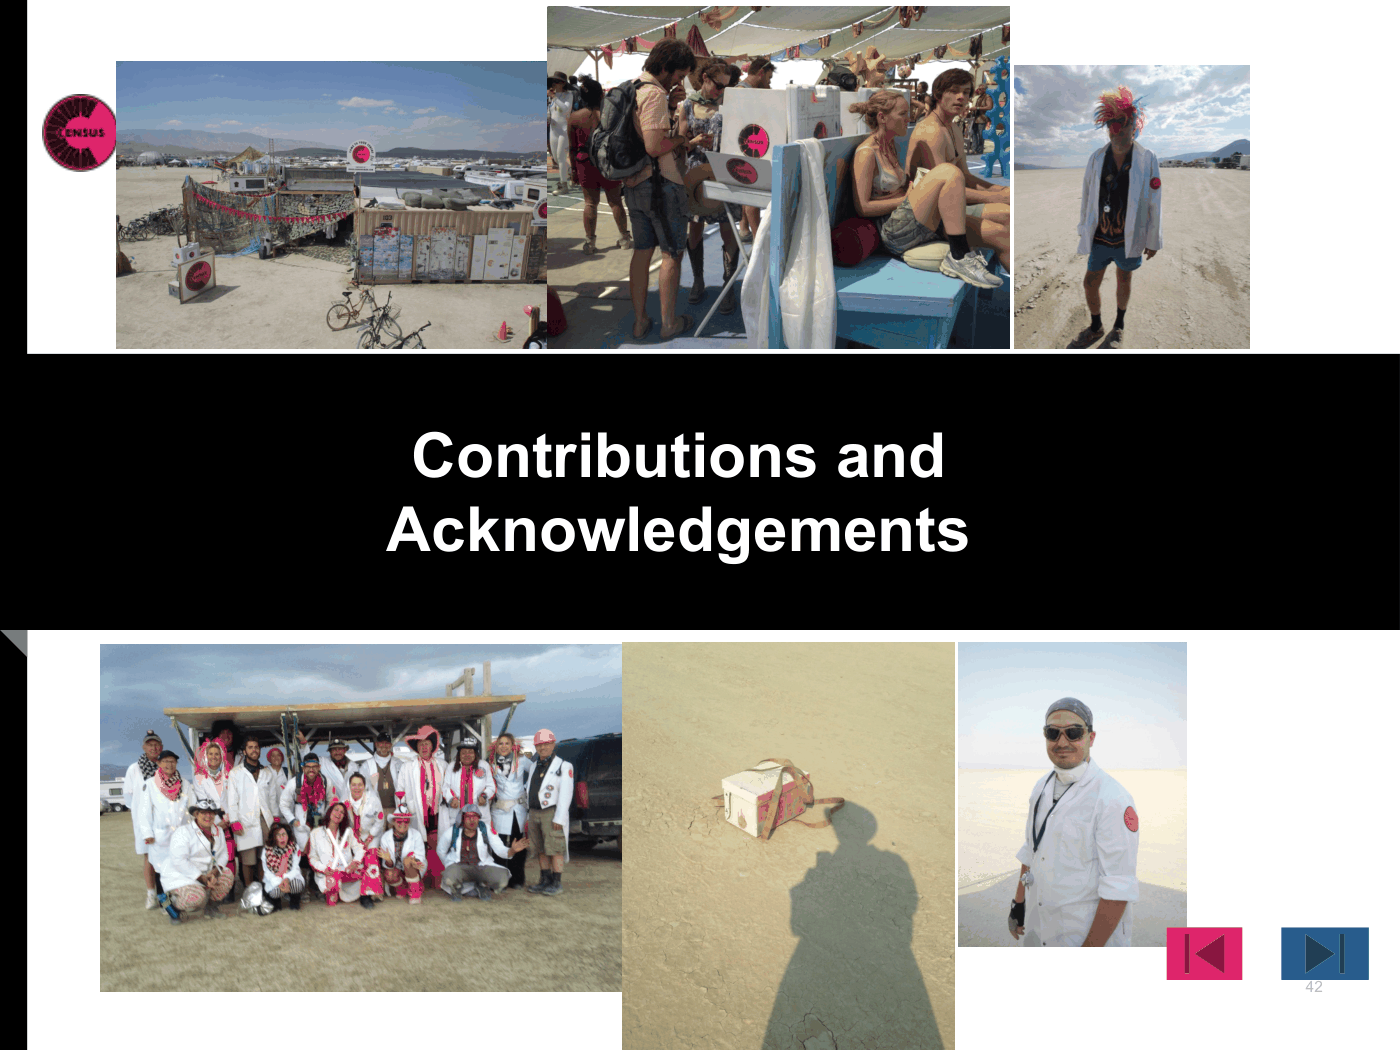
Contributions and acknowledgements
Project coordination: Megan Heller (Countess), David Nelson-Gal (Scribble), Dominic Beaulieu-Prévost (Hunter) and Kateri McRae (Variance) are the principal investigators who led the 2014 Census project.
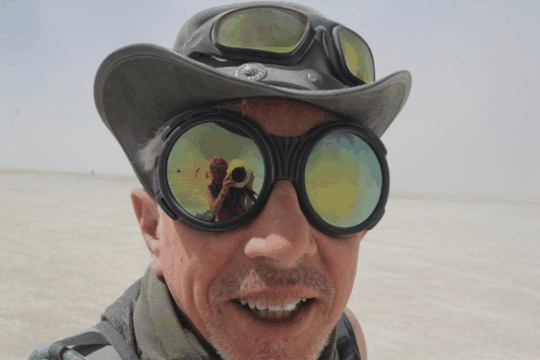
Sampling & data analysis:
Dominic Beaulieu-Prévost (Hunter)
Report coordination, graphics, layout & design:
David Nelson-Gal(Scribble) & Andrew Pedersen
The 2014 Census Lab : The project also involved numerous other volunteers whose contributions were essential in many ways : research collaborators, volunteer coordinators, statisticians, camp builders, gate samplers, keypunchers, census lab hosts, graphic designers, and many more. These contributors will globally be referred to as “the Census Lab”. We would also like to thank the Burning Man organization for the resources that they provided both on playa and off playa and for believing in the project.
Special thanks to Entropy for rescuing our volunteers at Gate on stormy Monday.
A final thanks to all the BRC citizens who contributed to the 2014 Census. The Census project could not exist without you.
Still Curious?
For more information about the 2014 Census project or the people involved in the project, please write to census@burningman.org .
For more information about this report, please write to Dominic Beaulieu-Prévost at beaulieu-prevost.dominic@uqam.ca .
You can also access the Census blog at http://blackrockcitycensus.wordpress.com .
Citation: Heller, S.M., Beaulieu-Prévost, D., McRae, K, Nelson-Gal, D., and the 2014 Census Lab. (2014). 2014 Black Rock City Census: Weighted results report. Black Rock City Census. Copyright © 2014 Heller et al. This is an open-access report distributed under the terms of Creative Commons Attribution License, which permits unrestricted use, distribution, and reproduction in any medium, provided the original author and source are credited.